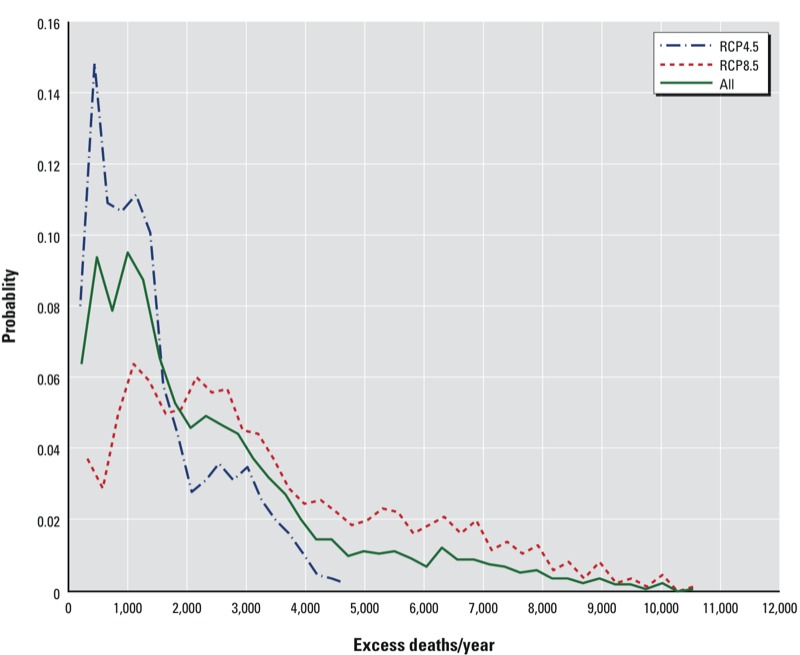
Figure 3.

Probability distribution of annual excess mortality attributable to heat waves in the study domain under RCP4.5, RCP8.5, and the two scenarios combined. Data shown were derived from pooling the total excess deaths under all possible situations considered in this study, including two temperature calibration methods, four heat wave definitions, four population projections, 3 years, and nine sets of AR values.
