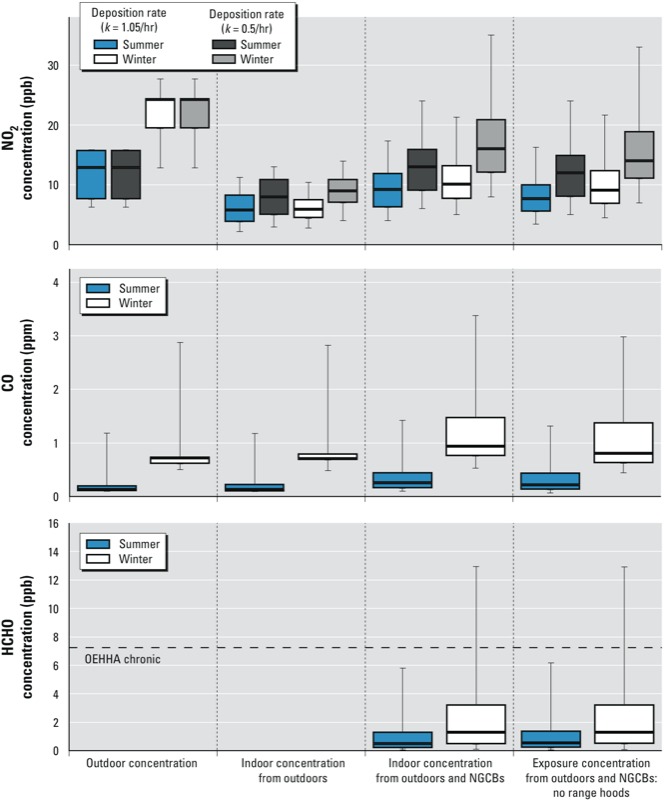
Figure 2.

One-week time-averaged indoor pollutant concentrations estimated by simulation modeling for weighted sample of 6,634 of SoCal homes. Both summer (scenario 2) and winter (scenario 1) results presented in this figure assume no range hood use and apply near-source proximity factors to estimate exposure concentrations. Boxes indicate 25th (bottom), 50th (line within box), and 75th (top) percentiles; whiskers represent 5th and 95th percentiles. Dashed horizontal lines are standards from Table 1 that are within ranges shown on graphs. Results presented for scenario 1 are the mean values from 15 model executions. See Supplemental Material, Table S3, for tabulated results.
