
Figure 3.
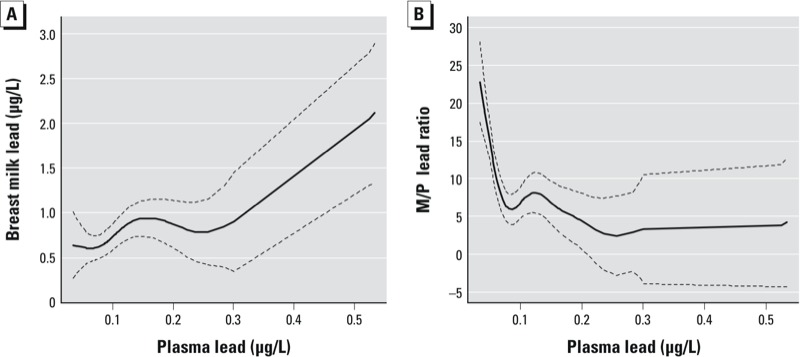
Nonlinear dose–response relationship between plasma lead and breast milk lead (EDF = 4.2) (A) and M/P ratio (EDF = 6.5) (B), from GAMs using penalized splines and adjusted for maternal age, dietary calcium intake, and systolic blood pressure. The M/P ratio decreased by 16.6 (95% CI: –24.6, –8.7) and 0.6 (95% CI: –2.5, 1.2) per 0.1‑μg/L plasma lead below and above 0.1 μg/L plasma lead, respectively, in a piecewise linear multivariate model. Solid lines represents effect estimates and dashed lines represent 95% CIs.