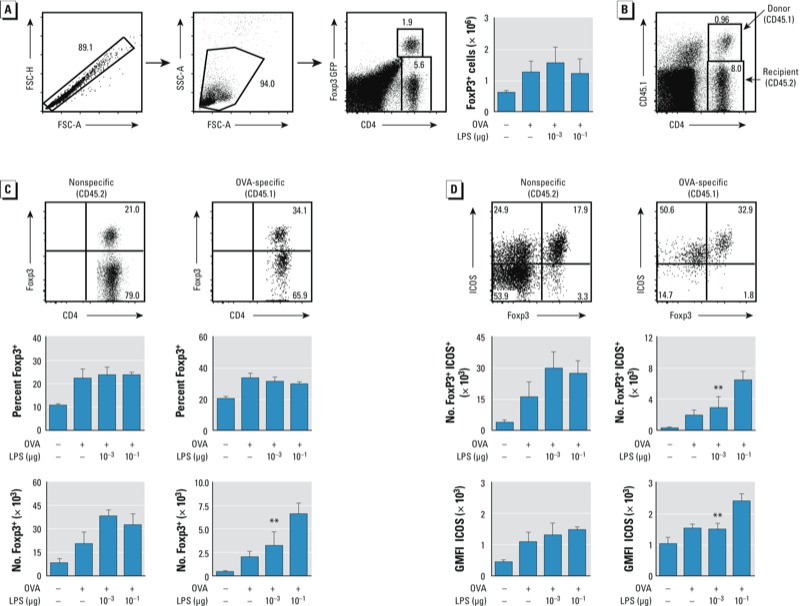
Figure 6.

Analysis of Tregs in Foxp3gfp mice. Abbreviations: FSC, forward scatter; GMFI, geometric mean of fluorescent intensity; SSC, side scatter. (A) Gating strategy used to identify CD4+ Foxp3+ Tregs, as well as total numbers of Tregs in mice sensitized to OVA using the LPS and subsequently challenged with OVA on 6 consecutive days (right). (B) Gating strategy for OVA-specific OT‑II (CD45.1) and nonspecific (CD45.2) Foxp3+ Tregs. (C) Gating for nonspecific (left) and OVA-specific (right) Foxp3+ cells (top) and the percent (middle) and number (bottom) of CD4+ T cells that express Foxp3. (D) ICOS display on nonspecific (left) and OVA-specific (right) Foxp3+ Tregs. Gating for ICOS+Foxp3+ cells (top), numbers of CD4+ Foxp3+ cells displaying ICOS (middle), and GMFI (and SE) for ICOS staining (GMFI ICOS; bottom). Data are from one of two experiments yielding similar results (n = 4–5 mice/group for all experiments). **p < 0.05 for 10–3 μg LPS compared with 10–1 μg LPS.
