FIG 1:
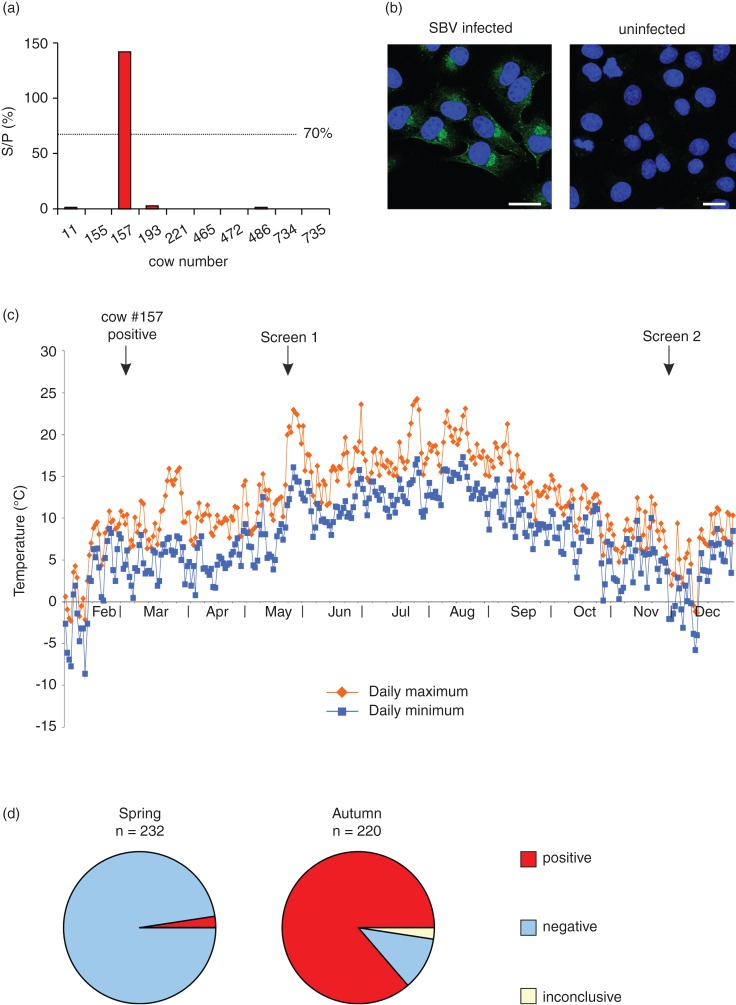
(a) Sera of a selection of cattle tested for the presence of antibodies to Schmallenberg virus (SBV) in February 2012. Sample-to-positive ratios (S/P) are expressed as percentages and values >70 per cent are regarded as positive. All animals were negative with the exception of cow #157. (b) SBV infected (left) and uninfected (right) BHK21 cells were immunolabelled with sera from cow #157 and analysed by immunofluorescence microscopy. Fluorescent signal was only observed in cells infected with SBV. Bar=10μm. (c) Maximum and minimum daily temperatures for the period February–December 2012 at the nearest weather station (Lyneham, approximately 4.8 km from the farm described in this study), with arrows indicating dates of significance during this study. Data were obtained from the UK Meteorological Office, Met Office Integrated Data Archive System (MIDAS) Land and Marine Surface Stations Data (1853-current), NCAS British Atmospheric Data Centre, 2012. ‘Screen 1′ and ′Screen 2’ represent the points of whole-herd screening for SBV antibodies. (d) Seroprevalence was determined for the entire herd in the spring (May) and autumn (November) 2012, and was found to rise from 1.7 per cent in the spring to 89.1 per cent in the autumn.

