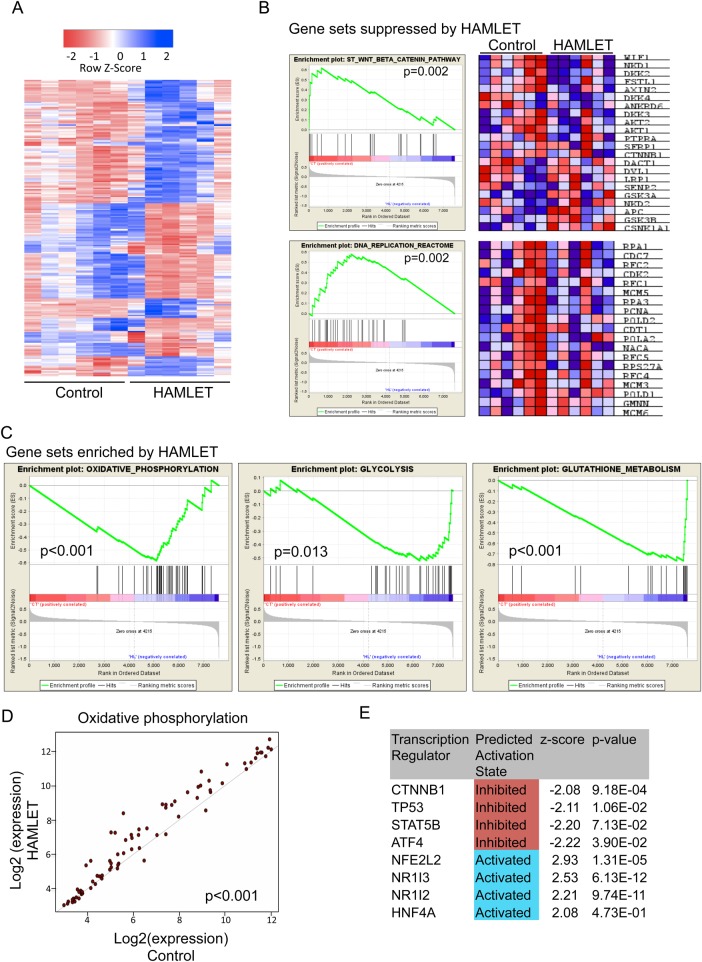
Figure 6.
Whole-genome profiling identifying distinct transcriptional events in tumours after human α-lactalbumin made lethal to tumour cells (HAMLET) prophylaxis. (A) Heat map of differentially expressed genes (log 2 fold change >1 and false discovery rate (FDR)-adjusted p value<0.05, n=224) between HAMLET and mock treated tumours, indicating that there are distinct differences between the two groups. (B) Gene sets depleted by HAMLET treatment included β-catenin and DNA replication pathways. Heat maps shows expression of individual genes for each tumour. See also online supplementary figure S8. (C) Expression of genes involved in oxidative phosphorylation (p<0.001), glycolysis (p=0.013) and glutathione metabolism (p<0.001) were enriched after HAMLET treatment. (D) Scatterplot visualisation of genes in the oxidative phosphorylation pathway showing a coordinated increase in expression of almost all genes after HAMLET treatment (p<0.001). (E) Ingenuity Pathway Analysis highlighting suppressed and enhanced transcription factors. β-Catenin (CTNNB1) signalling is inhibited in HAMLET-treated tumours.

