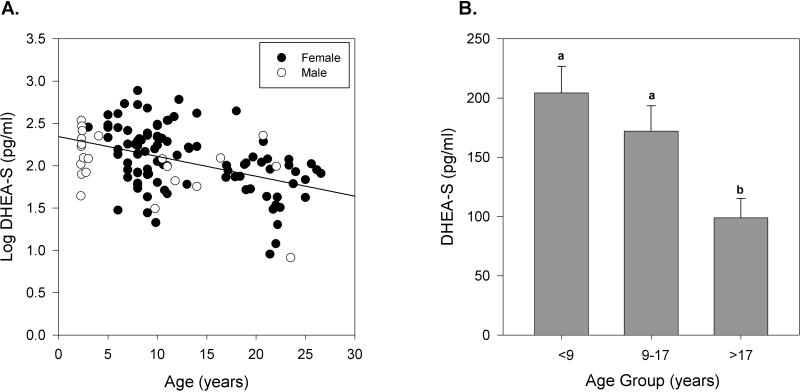
Figure 3.
The effects of age and gender on serum DHEA-S concentration (pg/ml) in baboons. A. Distribution of serum DHEA-S (log-transformed) in individual baboons of different ages (n = 118). Age (P < 0.01) but not gender was significantly correlated to serum DHEA-S concentration within this population of baboons. Female baboons are depicted in solid circles and male baboons in open circles. The black line represents the linear regression results for all individuals. B. Comparison of mean serum DHEA-S (pg/ml) in all baboons by age group (<9 yrs, n = 43; 9-17 yrs, n = 40; >17 yrs, n = 35). Data are expressed as means ± SEM of the non-transformed values. Means with no common letters differ significantly, P ≤ 0.05.

