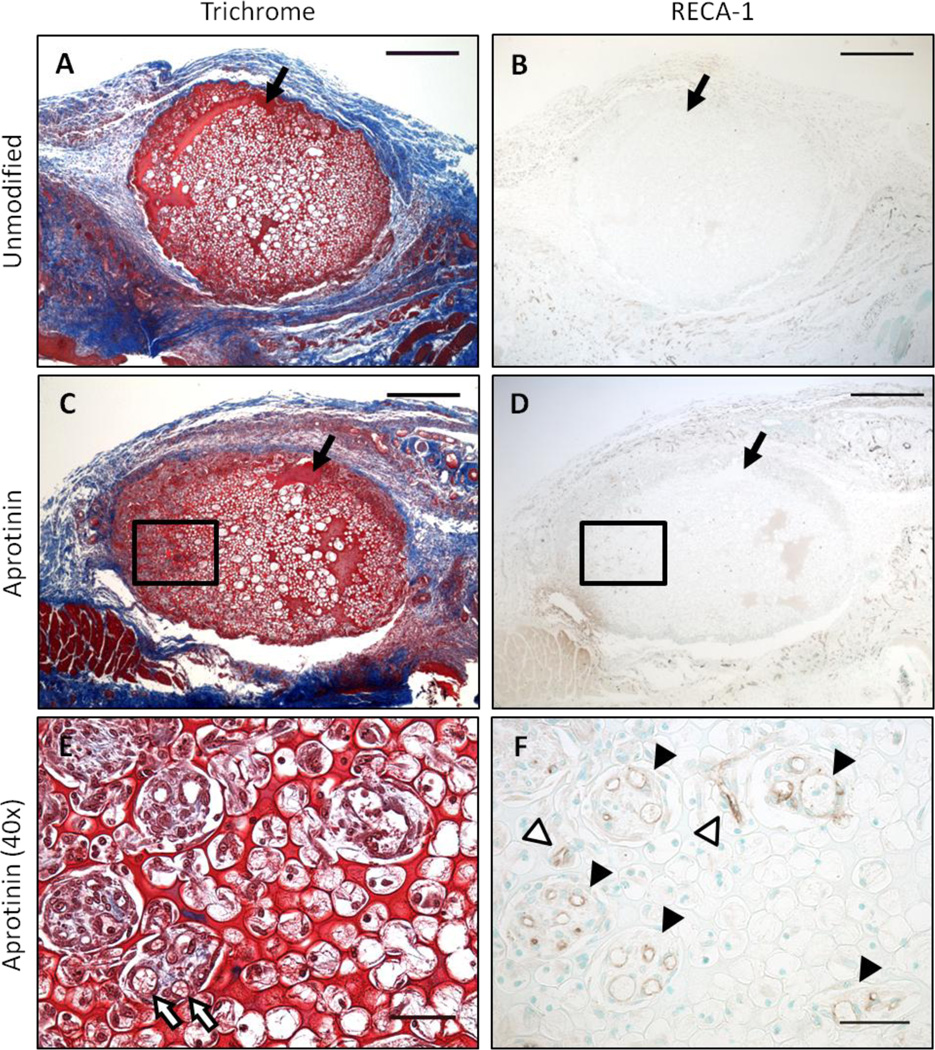
Fig. 3.
Vascularization response to implanted scaffolds. Representative images of (a & b) unmodified and (c–f) aprotinin scaffold implants after 7 days of implantation. (a, c, & e) Masson’s trichrome staining with (b, d, & f) RECA-1+ staining of a consecutive section. Outlined areas in (c) and (d) are shown at higher magnification in (e) and (f), respectively. Black arrows indicate fibrin material, white arrows indicate red blood cells within lumen structures, black arrowheads indicate RECA-1+ lumen structures in scaffold channels, white arrowheads indicate RECA-1+ lumen structures in scaffold pores. Scale bars in (a–d) = 500µm. Scale bars in (e) and (f) = 50µm.

