
Figure 6.
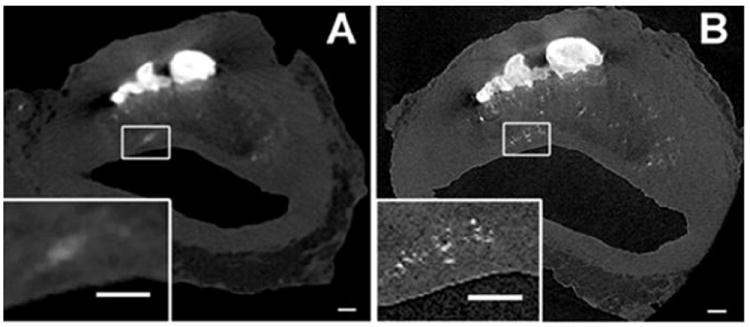
High resolution μCT images of human coronary atheroma with μCalcs embedded in the fibrous cap proper. Panel A shows images scanned at 6.7-μm resolution. B was scanned at 2.1-μm resolution. Multiple μCalcs in the cap are visible in panel B magnified view, previously undetected in panel A. Magnified view of panels A and B show the difference between what appears to be a single μCalc at 6.7-μm and μCalc clusters when viewed at 2.1-μm resolution. Scale bar = 200 μm. (Reproduced with permission from Kelly-Arnold et al., Proc Natl Acad Sci U S A).