
Figure 7.
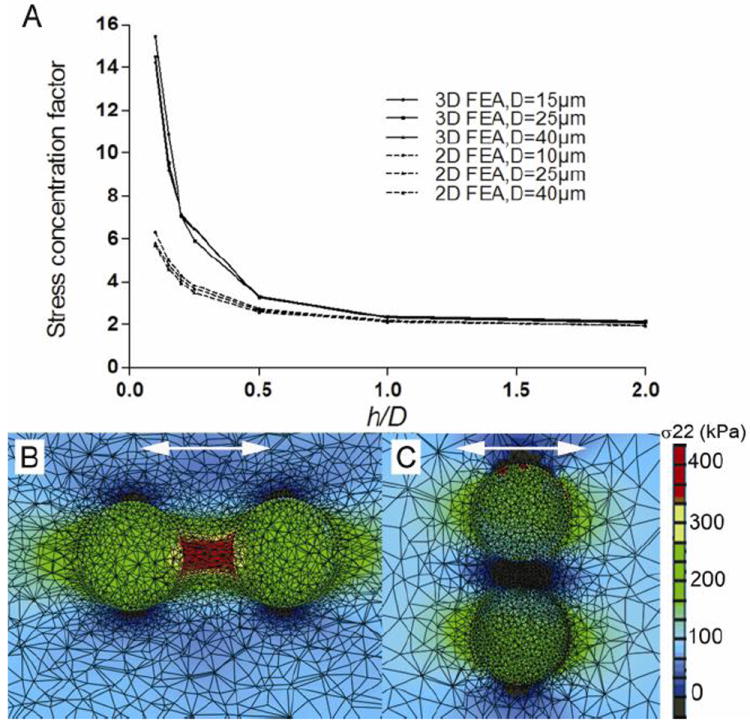
A) 3D FEA results of stress concentration factor calculated for the area between two particles located along the tensile axis in a fibrous cap. Stress concentration factor rises exponentially when the distance between the two spherical μCalcs decreases. Results are compared with previous 2D FEA reported in Maldonado et al. 55. B and C show FEA results for particles with initial h/D=0.3 oriented along and transverse the tensile axis respectively. (Reproduced with permission from Kelly-Arnold et al., Proc Natl Acad Sci U S A).