
Figure 9.
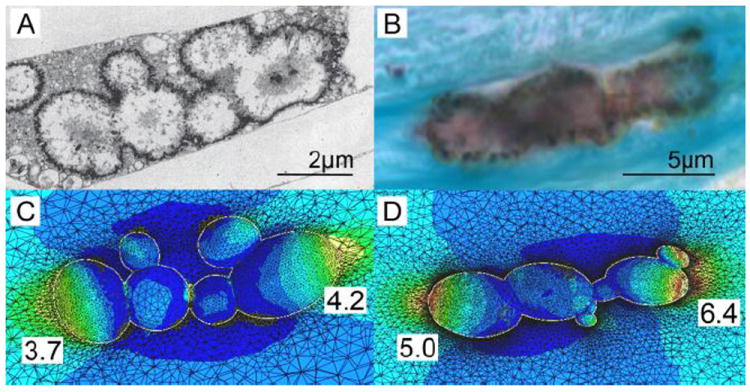
TEM and histology based FEA. A) TEM image of aggregated calcifying matrix vesicles forming μCalcs in a mouse atheroma. B) Image of a μCalc embedded in a human fibrous cap, obtained from non-decalcified histology, stained von Kossa. C) and D) Stress distribution at the interface of the μCalcs in A and B respectively, assuming they are embedded in fibrous caps under tension. Numbers show calculated stress concentration factor at the poles. (Reproduced with permission from Kelly-Arnold et al., Proc Natl Acad Sci U S A).