Figure 3.

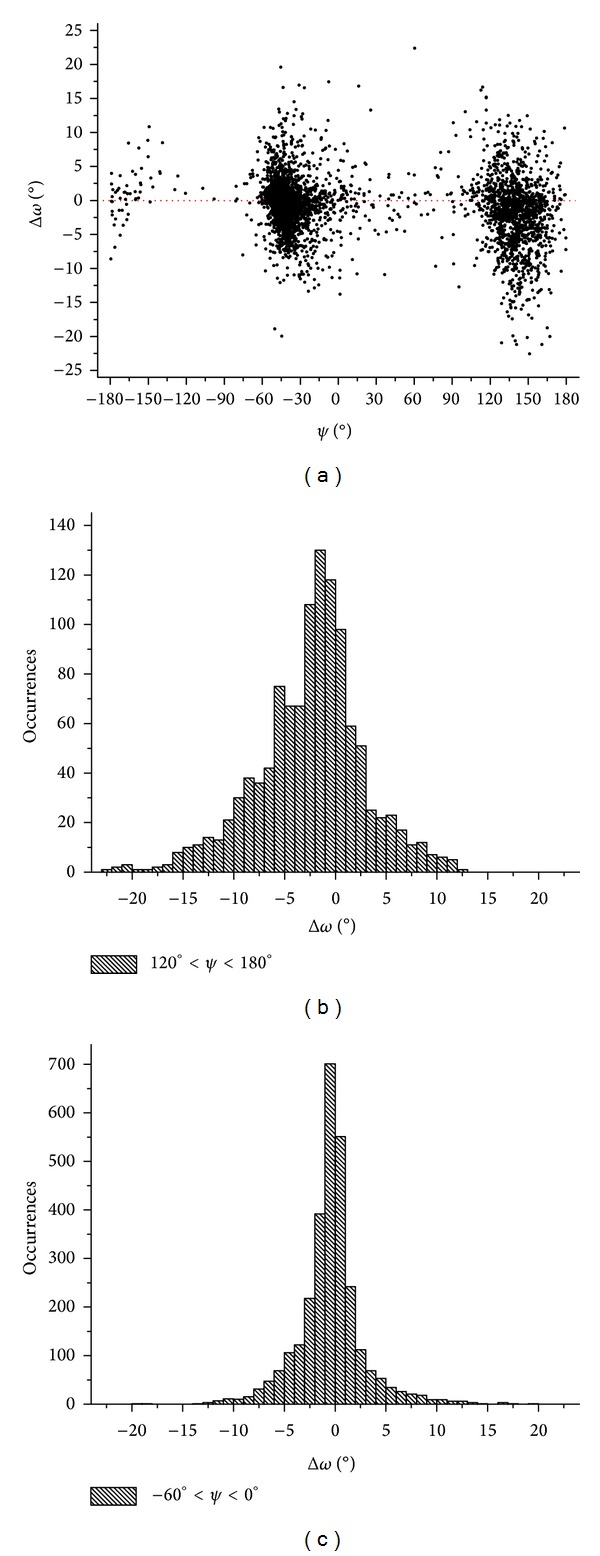
Δω variability in transmembrane residues. In panel (a), Δω versus ψ is reported. The distribution of Δω values exhibited by residues of α-helices and β-sheets is reported in panels (b) and (c), respectively.

Δω variability in transmembrane residues. In panel (a), Δω versus ψ is reported. The distribution of Δω values exhibited by residues of α-helices and β-sheets is reported in panels (b) and (c), respectively.