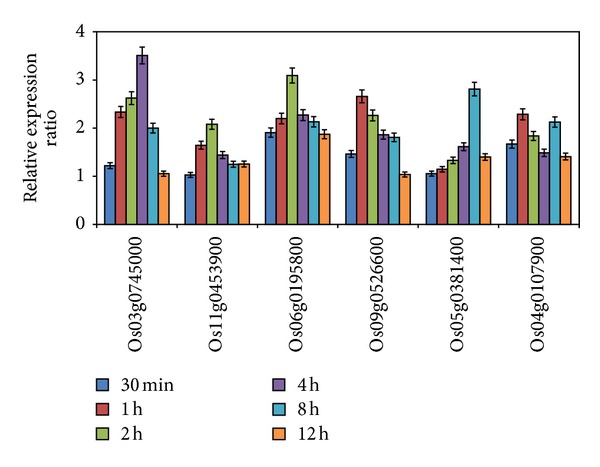
Figure 5.

Expression profiles of the six genes in response to ABA treatment. Three-week-old rice seedlings were subject to 100 mmol L−1 ABA. Error bars in the figures indicate standard deviation.

Expression profiles of the six genes in response to ABA treatment. Three-week-old rice seedlings were subject to 100 mmol L−1 ABA. Error bars in the figures indicate standard deviation.