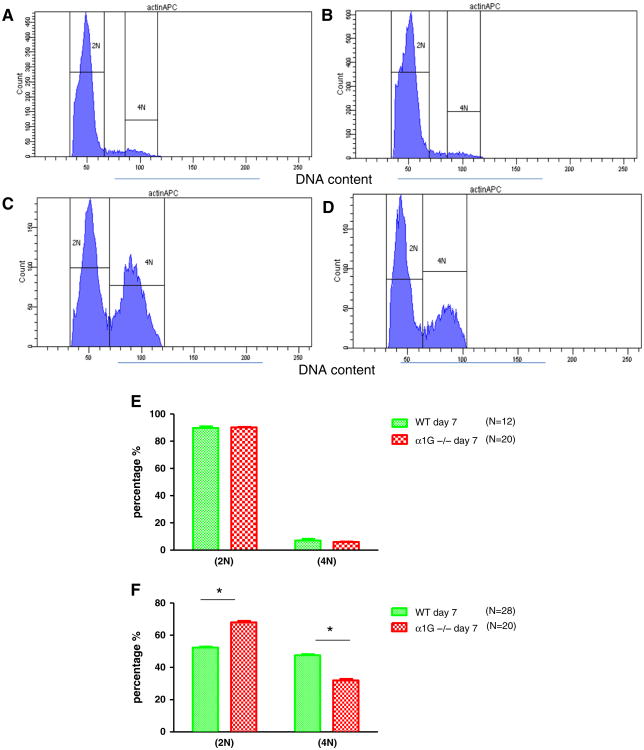
Fig. 4.
Representative DNA quantity analysis of isolated NMVMs using flow cytometry. NMVMs were isolated on day 1 and day 7 after birth and then DNA content analysis was performed. Single cells were gated. An antibody against cardiac actin was used to identify NMVMs. (A) wild type NMVMs on day 1. (B) α1G−/− NMVMs on day 1. (C) Wild type NMVMs on day 7. (D) α1G−/− NMVMs on day 7. Increased DNA content was observed in NMVMs at 7 days after birth versus 1 day after birth (within groups). There were more WT than α1G−/− myocytes with 4N DNA content. (E) There was no significant difference in DNA content between wild type and α1G−/− on day 1 after birth. (F) The percentage of NMVMs with 2N DNA content decreased in both WT and α1G−/−, however there were significantly fewer α1G−/− NMVMs with 4N DNA content on day 7 after birth. *p < 0.001 (N: # of hearts).

