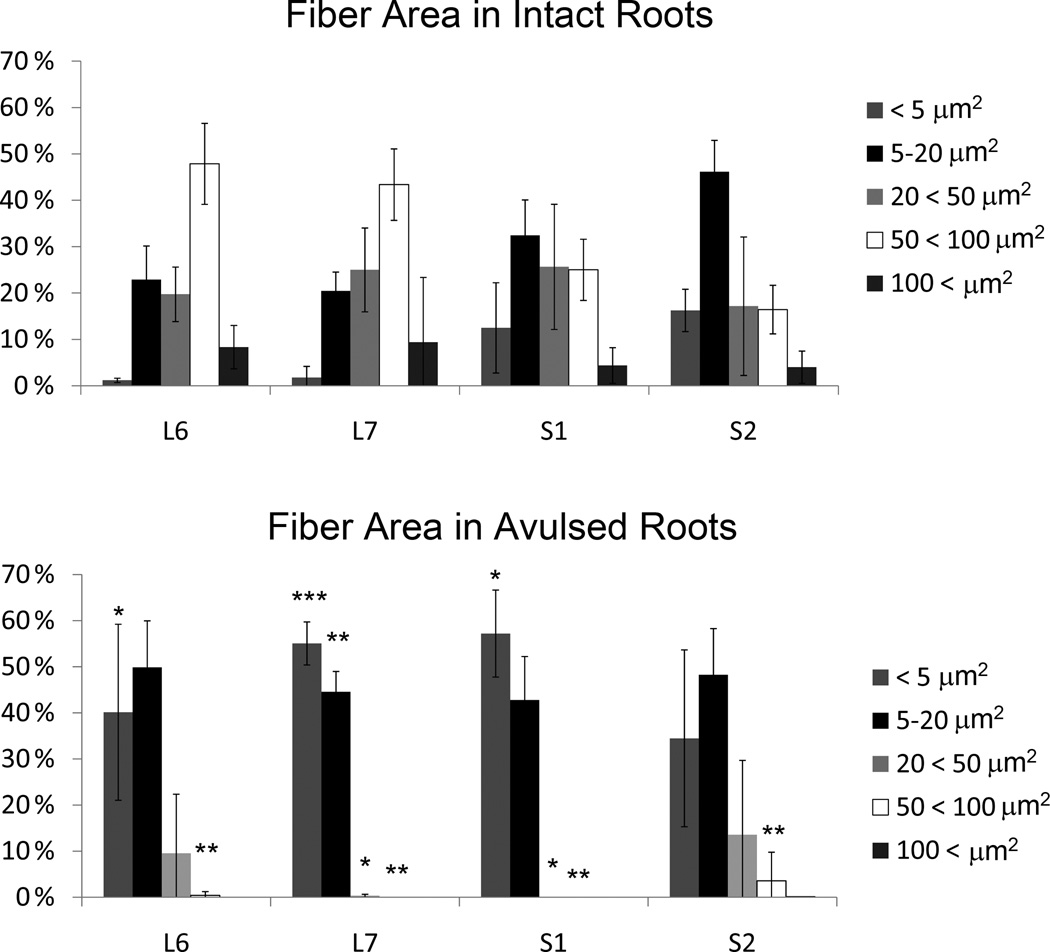
Figure 8.
Graph demonstrating the size distribution for the cross sectional fiber area in intact (upper graph) and avulsed (lower graph) L6-S2 ventral roots at 6–8.5 months after a unilateral VRA injury. Note the predominance of small myelinated fibers in the avulsed ventral roots with * indicating p < 0.05, ** indicating p < 0.01, and *** indicating p < 0.001.

