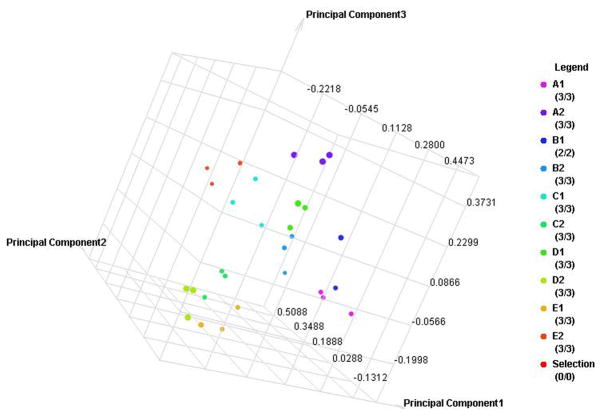
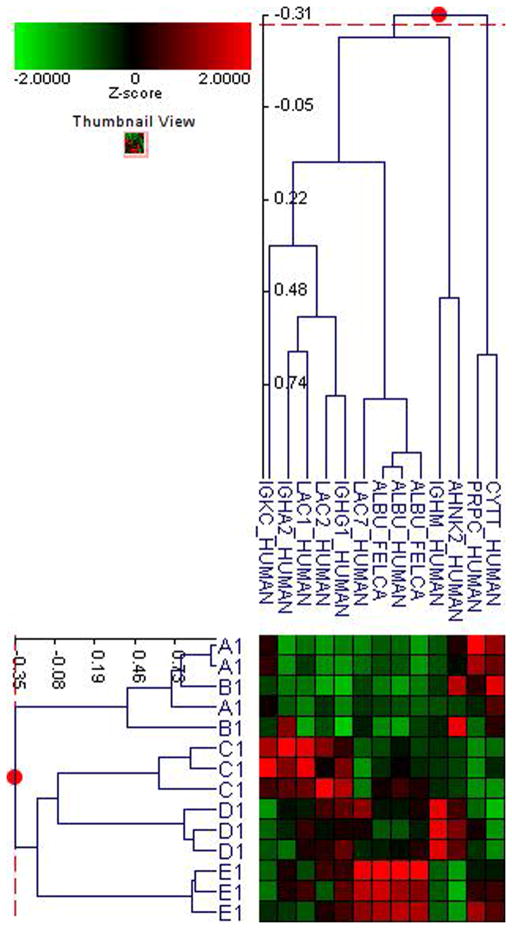
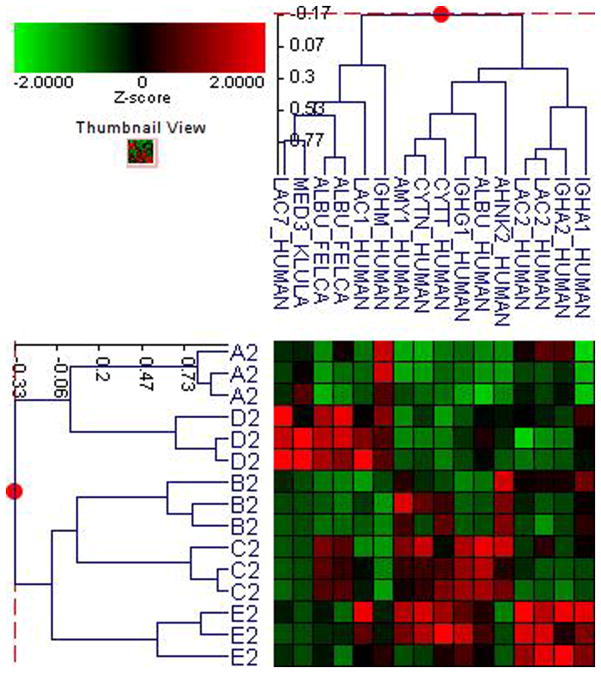
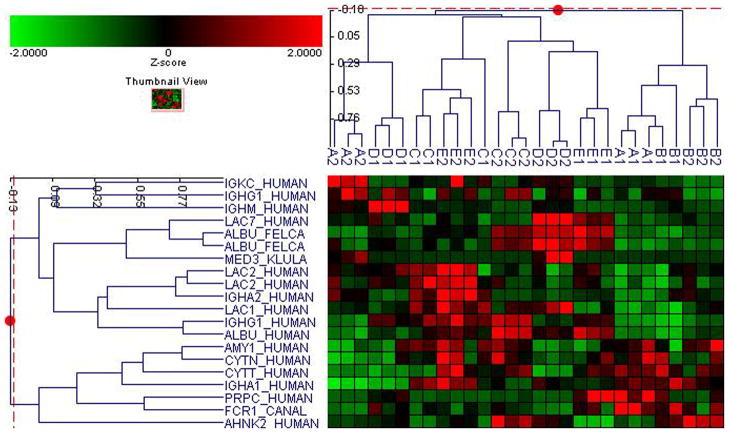
Figure 1. Pooled sample proteomic analysis.
A. Principle component analysis (PCA) of the proteomes from pooled saliva samples demonstrates differentially expressed peptides for each type of diabetes in each A1C group (A–E refer to levels of A1C <7, 7–8, 8–9, 9–10 and 1 for type 1 and 2 for type 2 diabetes).
B. Cluster analysis of type 1 diabetes demostrates differential expression of proteins based on ANOVA (p<0.05).
C. Cluster analysis of type 2 diabetes demostrates differential expression of proteins based on ANOVA (p<0.05).
D. Cluster analysis of both type 1 and 2 diabetes demostrates differential expression of proteins based on ANOVA (p<0.05).


