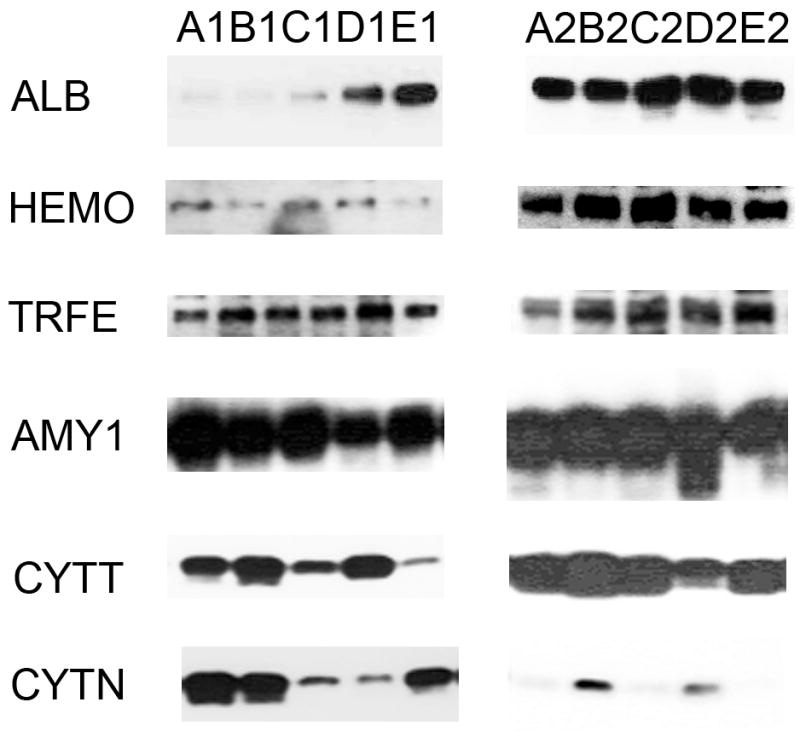
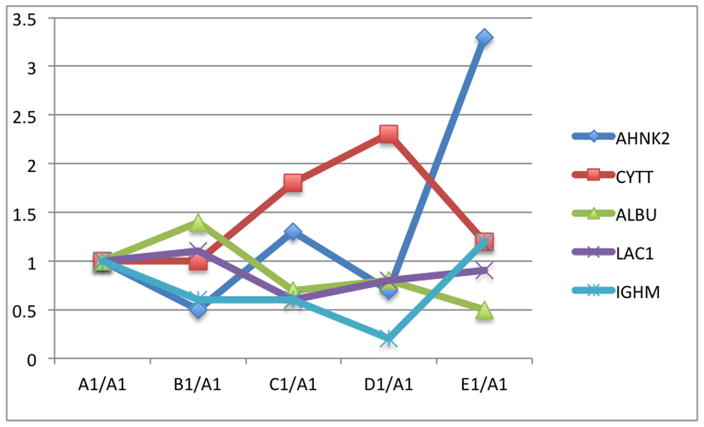
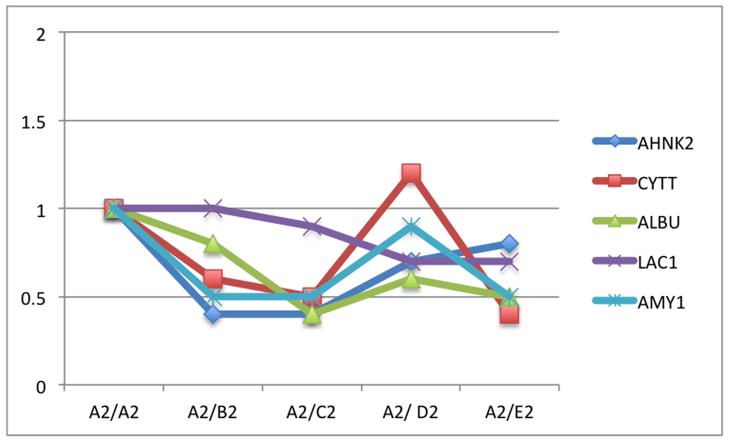
Figure 2.

The relative levels of expression of certain proteins in pooled saliva samples showing a comparison of the relative levels of expression of serum albumin precursor, cystatin-SA, immunoglobulin fragments, and protein AHNK2 with the increased A1C levels (A–E). The levels of expression were calibrated using the level of expression of the group with lowest A1C (A1 or A2). The graphs were plotted using the log expression level of each group divided by A1 for type 1 diabetes and A2 for type 2 diabetes.
A. Relative expression levels of selected peptide masses in type 1 diabetes
B. Relative expression levels of selected peptide masses in type 2 diabetes
C. Western blot analyses


