
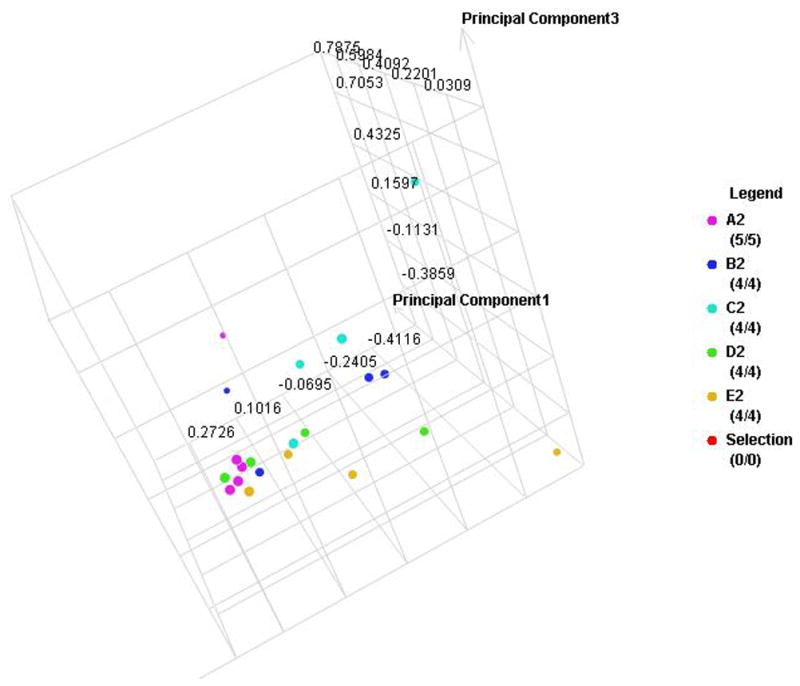
Figure 4. Individual sample proteomic analysis of five groups in each type of diabetes.
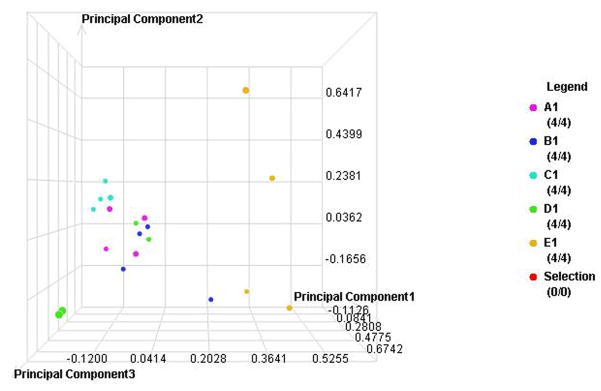


A. PCA of the proteomes from individual samples with type 1 diabetes
B. Cluster anlysis of type 1 diabetes
C. PCA of the proteomes from individual samples with type 2 diabetes
D. Cluster anlysis of type 2 diabetes