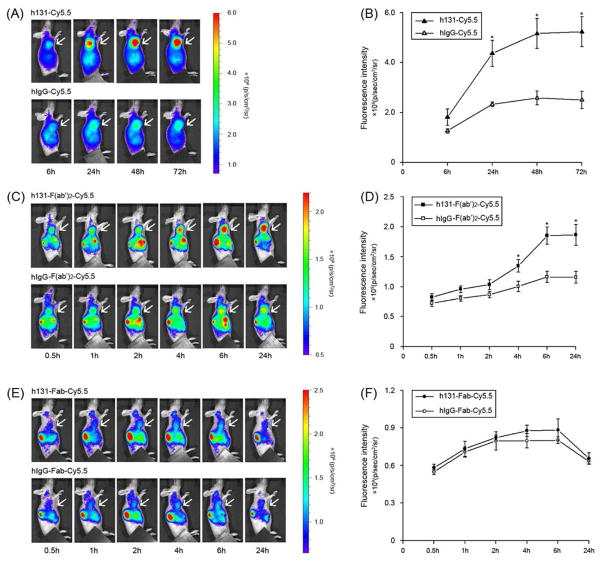
Figure 4.
In vivo near-infrared imaging (A) and quantification (B) of HT29 tumor-bearing mice after injection of h131-Cy5.5 or hIgG-Cy5.5; in vivo near-infrared imaging (C) and quantification (D) of HT29 tumor-bearing mice after injection of h131-F(ab′)2-Cy5.5 or hIgG-F(ab′)2-Cy5.5; in vivo near-infrared imaging (E) and quantification (F) of HT29 tumor-bearing mice after injection of h131-Fab-Cy5.5 or hIgG-Fab-Cy5.5. The P value was calculated with Student’s t test. *, P < 0.05.

