Fig. 3.
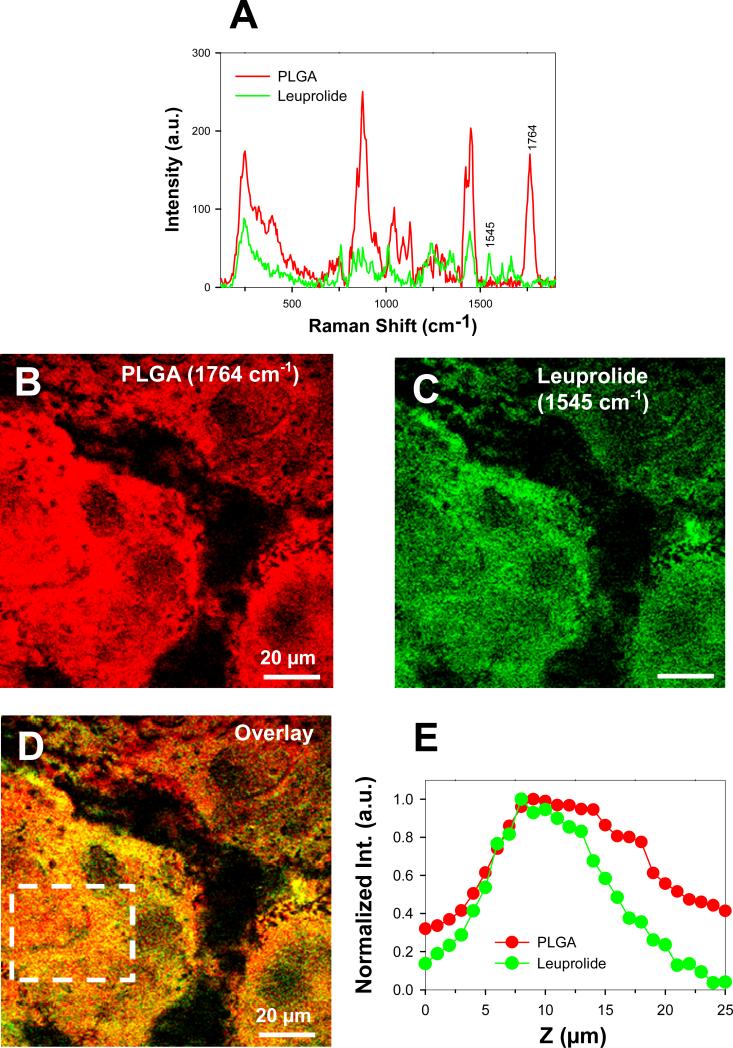
Direct visualization of peptide (leuprolide) penetration in PLGA film by SRS imaging. A) Raman spectra from pure PLGA film (red) and leuprolide (green). The peaks at 1764 cm−1 and 1545 cm−1 were identified for selective SRS imaging of PLGA and leuprolide, respectively. B) SRS image of PLGA distribution (red) in the film at 1764 cm−1. C) SRS image of leuprolide distribution (green) at the same location and depth in the film at 1545 cm−1. D) Overlay image of B) and C). E) Average intensity of PLGA and leuprolide in the area indicated by the white box in D as a function of depth along the film. Data was normalized against maximum intensity values. Note that the bell-shaped intensity curves are present for both PLGA and leuprolide, and are an artifact of the SRS imaging method.

