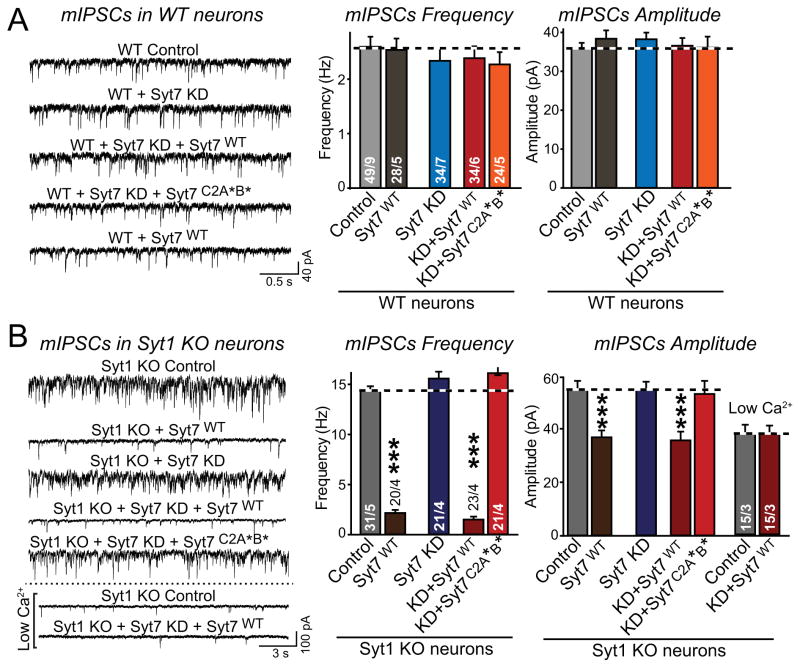
Figure 4. Syt7 KD does not alter spontaneous mIPSCs in WT or Syt1 KO neurons, but Syt7 overexpression clamps mIPSCs in Syt1 KO neurons.
A & B, mIPSCs measured in WT (A) and Syt1 KO neurons (B) as a function of Syt7 KD and/or Syt7 overexpression (left, representative traces; right, summary graphs of the mIPSC frequency and amplitude). Hippocampal neurons were infected with lentiviruses as described for Fig. 3, and mIPSCs were recorded in the presence of TTX (1 μM), CNQX (20 μM), and APV (50 μM). The apparently lower mIPSC amplitude upon Syt7 overexpression in Syt1 KO neurons, but not in WT neurons, resulted from overestimates of the mIPSC amplitudes in the other groups. In these groups, the very large mIPSC frequency makes simultaneous double mIPSCs appear as single large mIPSCs, prompting us to perform mIPSC recordings at low Ca2+-concentrations with decreased mIPSC frequency. These low Ca2+ recordings show that the IPSC amplitude is overestimated during high-frequency conditions (right panel).
All data are means ± SEM; numbers in bars indicate number of neurons/independent cultures analyzed. Statistical significance was assessed by one-way ANOVA (***, p<0.001) comparing test conditions to control.

