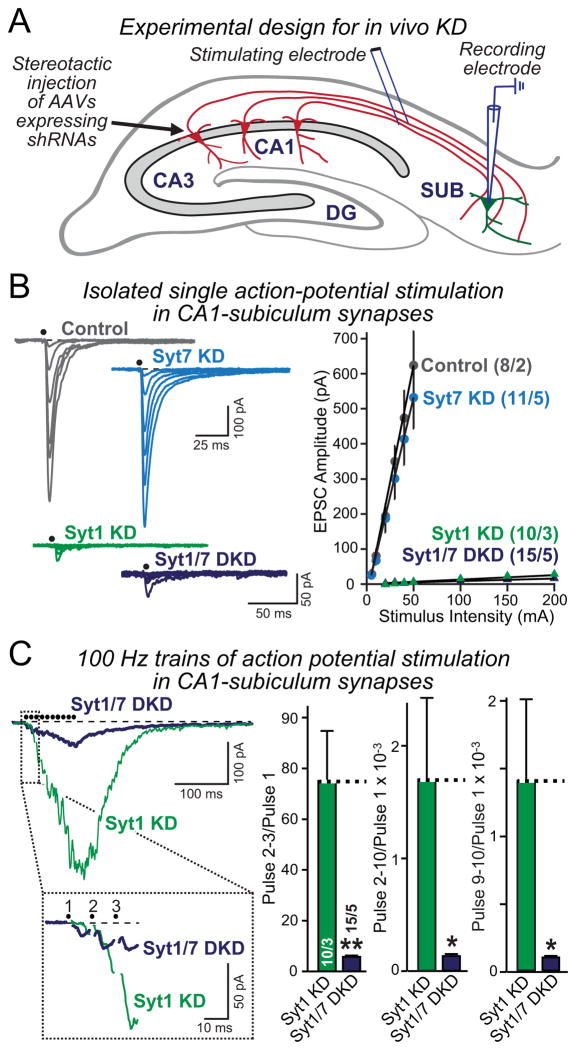
Figure 8. Syt7 KD impairs asynchronous release in Syt1-deficient neurons in vivo.
A, Schematic description of the experimental design for in vivo manipulations of Syt1 and Syt7 expression. The CA1 region of the hippocampus was infected by stereotactic injections at P21 in WT mice with control AAV or AAVs mediating the Syt1 or Syt7 KD alone or the combined Syt1 and Syt7 KD. Acute slices were analyzed at P35 by stimulating presynaptic fibers from the CA1 region and monitoring postsynaptic responses using whole-cell patch-clamp recordings in pyramidal neurons of the subiculum (which was not infected).
B, Measurements of EPSCs elicited by isolated stimuli applied with increasing strength to obtain input/output relationships in control, Syt1 KD, Syt7 KD, and Syt1/7 double KD mice (left, representative traces; right, summary graphs of the EPSC amplitude as a function of stimulus strength).
C, Measurements of EPSCs elicited by a 100 Hz, 0.1 sec stimulus train (left, representative traces with an expansion of the initial response below; right, summary graphs of the facilitation of EPSCs during the train as a measure of the activation of asynchronous release). Summary graphs show the ratios of the cumulative charge transfer for pulses 2–3, pulses 2–10, and pulses 9–10 in the train divided by that of the first pulse.
Summary data are means ± SEM; numbers in bars indicate number of neurons/mice analyzed. Statistical significance was assessed by one-way ANOVA (* p<0.05; ** p<0.01) comparing test conditions to control.

