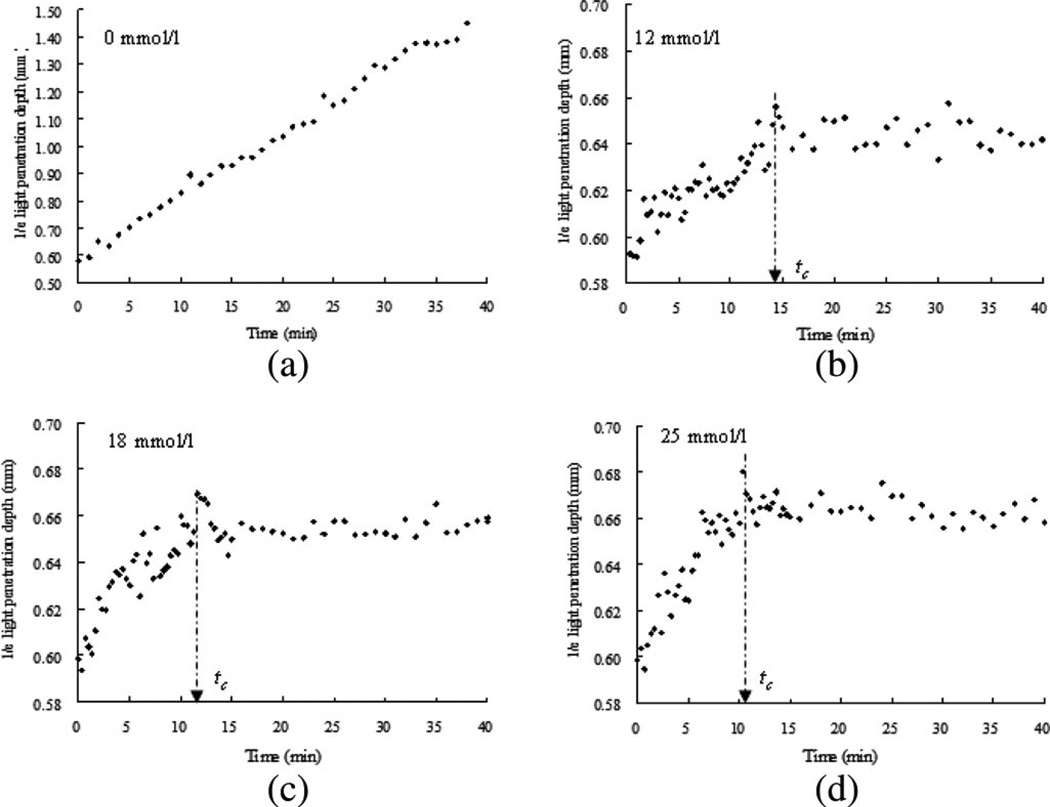
Fig. 2.
d1/e as a function of time obtained from coagulating blood samples induced by 12, 18, and 25 mmol/L calcium chloride, including the samples without calcium ions (n = 3). The clotting time tc is indicated by an arrow symbol. The clotting time was decreased with the increase of calcium concentration. Measuring points were taken every 20 s up to 15 min and every 1 min from 15 to 40 min.

