
Table 1.
Socio-demographic characteristics
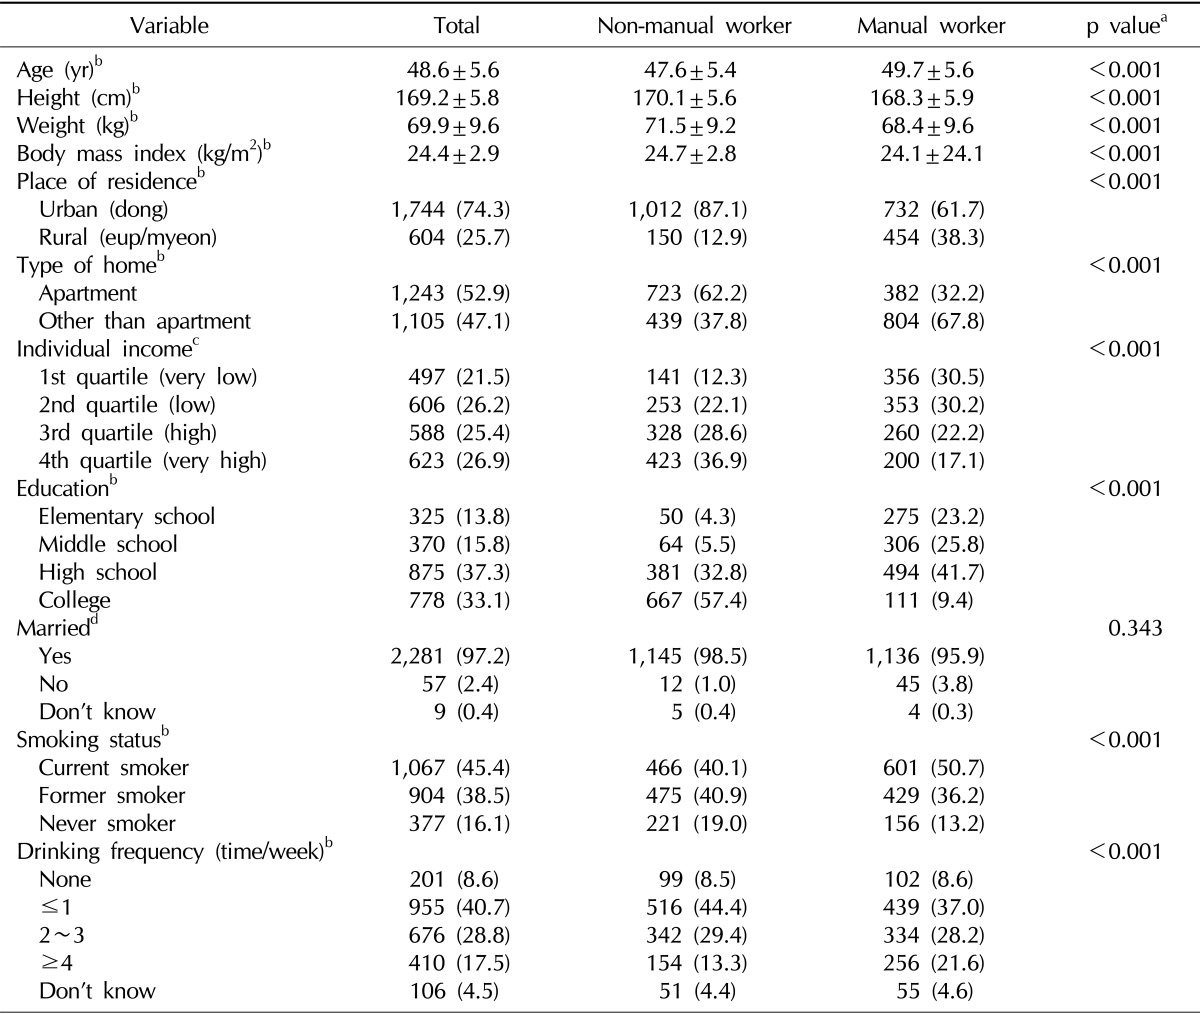
Values are presented as mean±standard deviation or number (%).
aChi-squared test or t-test. bn=2,348, cn=2,314, dn=2,347.
Official websites use .gov
A
.gov website belongs to an official
government organization in the United States.
Secure .gov websites use HTTPS
A lock (
) or https:// means you've safely
connected to the .gov website. Share sensitive
information only on official, secure websites.
Socio-demographic characteristics
Values are presented as mean±standard deviation or number (%).
aChi-squared test or t-test. bn=2,348, cn=2,314, dn=2,347.