
Table 1.
Changes in prostate weight, activity of SOD and the apoptotic index in the experimental groups
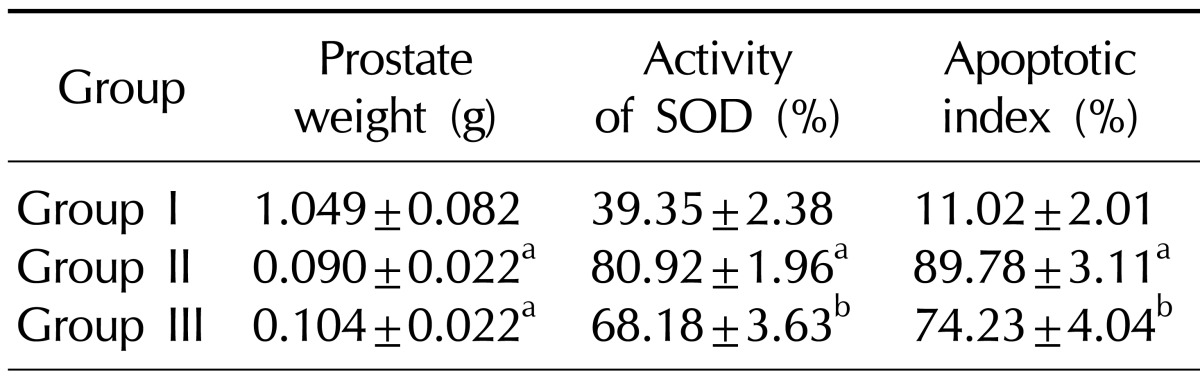
Values are presented as mean±standard deviation.
Group I: control group, Group II: andropause, Group III: andropause treated with anthocyanin.
SOD: superoxide dismutase.
aSignificant difference (p<0.05) compared with the Group I. bSignificant difference (p<0.05) compared with the Group II.