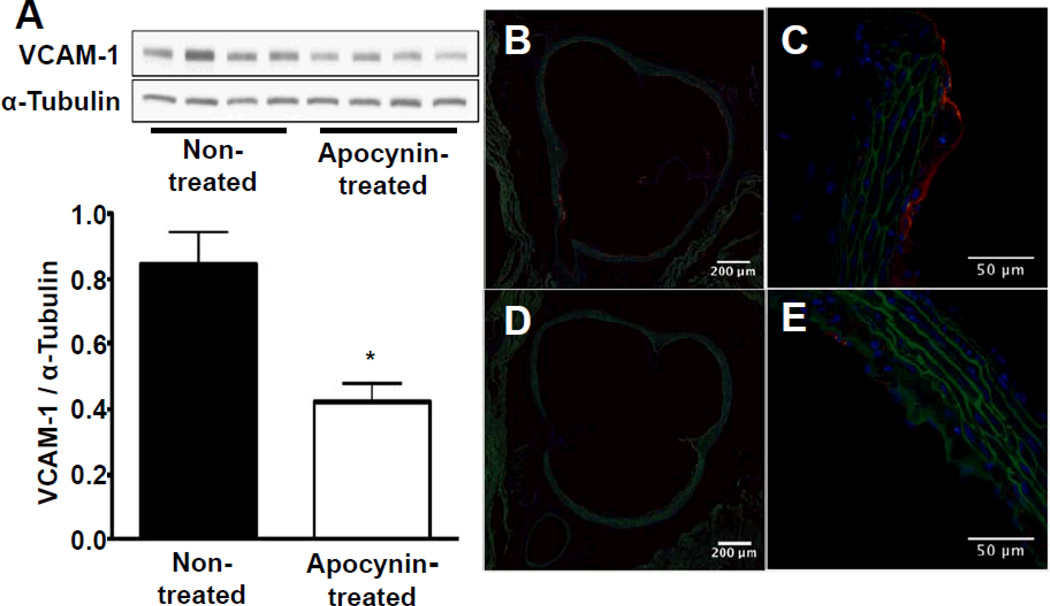
Figure 1.
Assessment of vascular cell adhesion molecule 1 (VCAM-1) expression after 7 days of saline or apocynin treatment. A, VCAM-1 protein expression in the ascending aorta assessed by Western blot in nontreated (lanes 1–4) vs apocynin-treated (lanes 5–8) animals, n=4 per group, *P<0.05 vs nontreated animals. Representative examples of fluorescent immunohistochemistry images of the base of the aorta demonstrating endothelial VCAM-1 expression (red fluorescence) in a nontreated animal at 10-fold magnification (B), in the same animal at 40-fold magnification (C), and reduced VCAM-1 expression in an apocynin-treated animal (D and E). Autofluorescence delineating vessel anatomy is shown in green, 4´,6-diamidino-2-phenylindole staining of the nuclei in blue.

