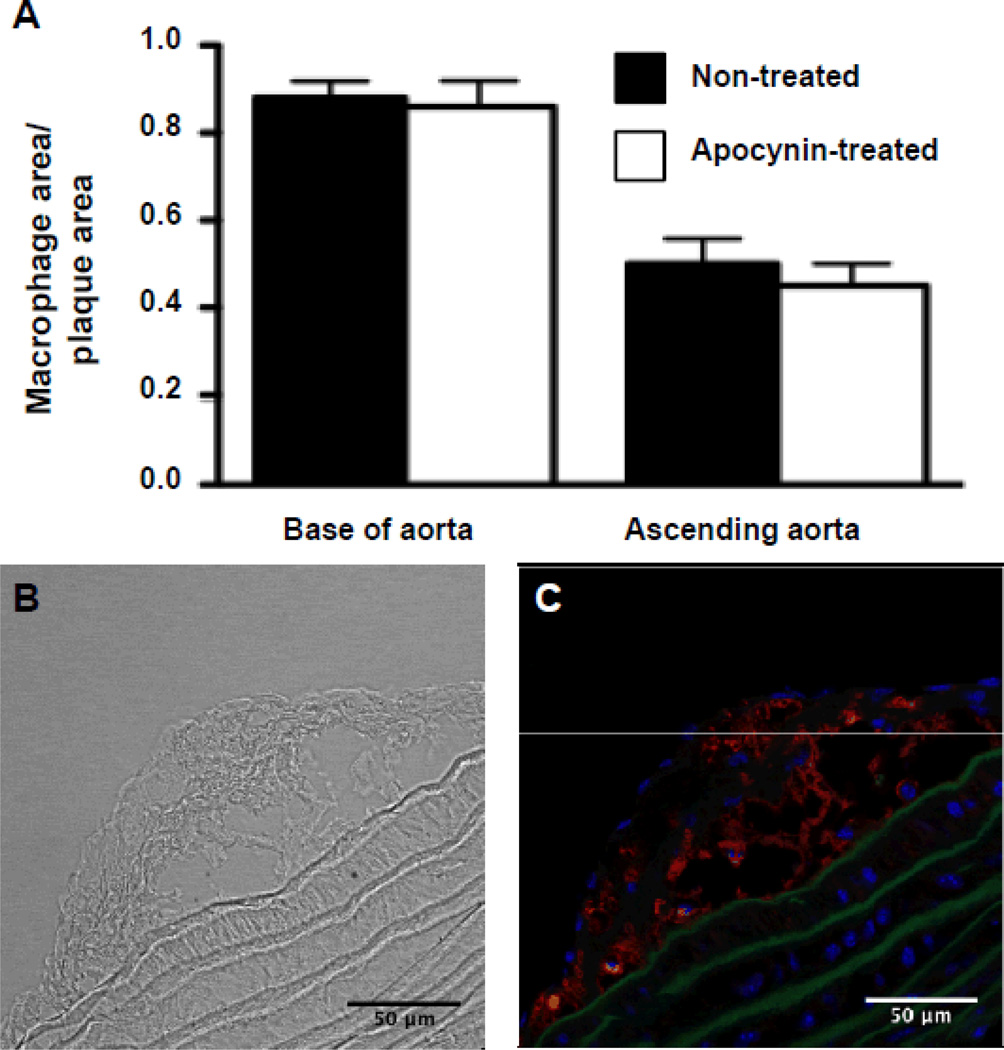
Figure 2.
Assessment of plaque macrophage content after 7 days of saline or apocynin treatment. A, Percentage of the plaque area covered with macrophages (Mac-2 staining) at the base of the aorta and in the ascending aorta (n=8 in each group; P=nonsignificant vs non-treated). B, Example of trans-illumination image used for plaque delineation. C, Example of Mac-2 staining used for quantification of macrophage content in the plaque.

