Figure 5.
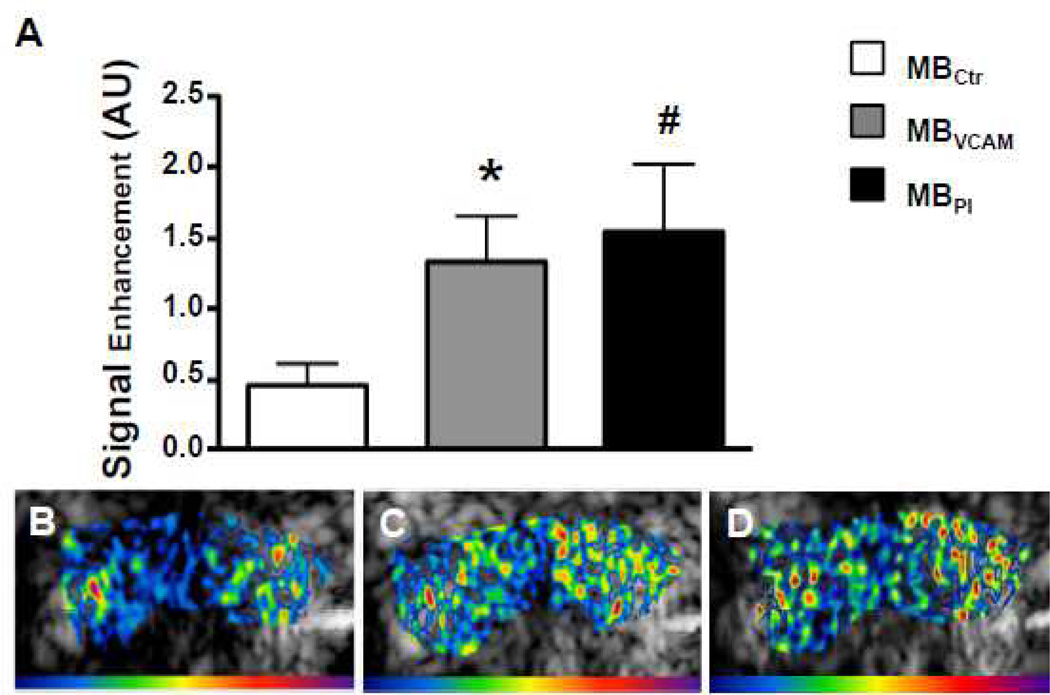
Molecular imaging of the ascending aorta before the start of treatment.A, Mean±SEM background-subtracted signal intensity for microbubbles targeted to vascular cell adhesion molecule 1 (VCAM-1; MBVCAM), to glycoprotein Ibα on activated thrombocytes (MBPl), and control microbubbles (MBCtr). *P<0.01 vs MBctr, #P<0.05 vs MBctr(n=12). Examples of color-coded contrast-enhanced ultrasound (CEU) images after injection of MBCtr (B), of MBVCAM (C), and of MBPl (D). The color scale for the CEU images is shown at the bottom of each frame.

