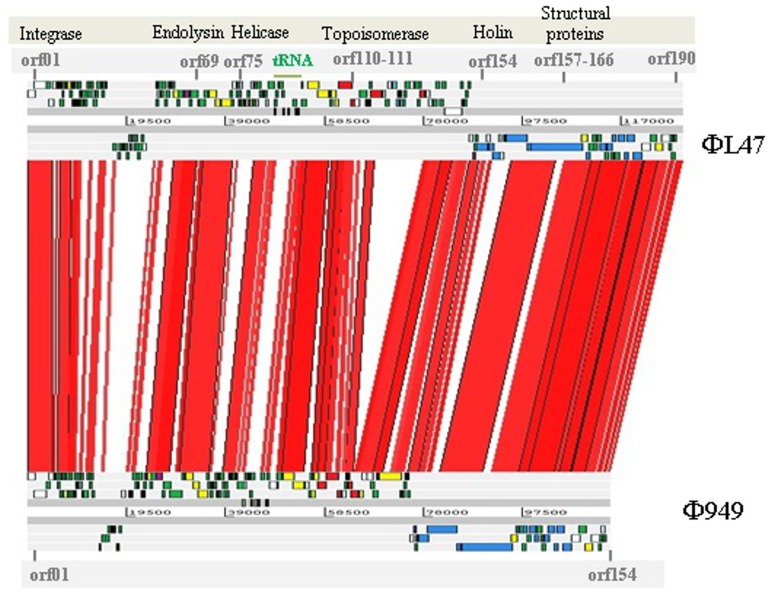
Figure 5.
BLASTn-based alignment (nucleotide identity >90% shown) of the genome sequences of L. lactis phage ΦL47 and Φ949 as displayed by the Artemis comparison tool (ACT). Red lines between genomes indicate orthologs in the same orientation. Coding sequences are color coded as described in Figure 4; structural (blue), hypothetical (green), DNA replication (yellow), ribonucleotide reductase (red), endolysin-holin (mauve), unknown (gray).

