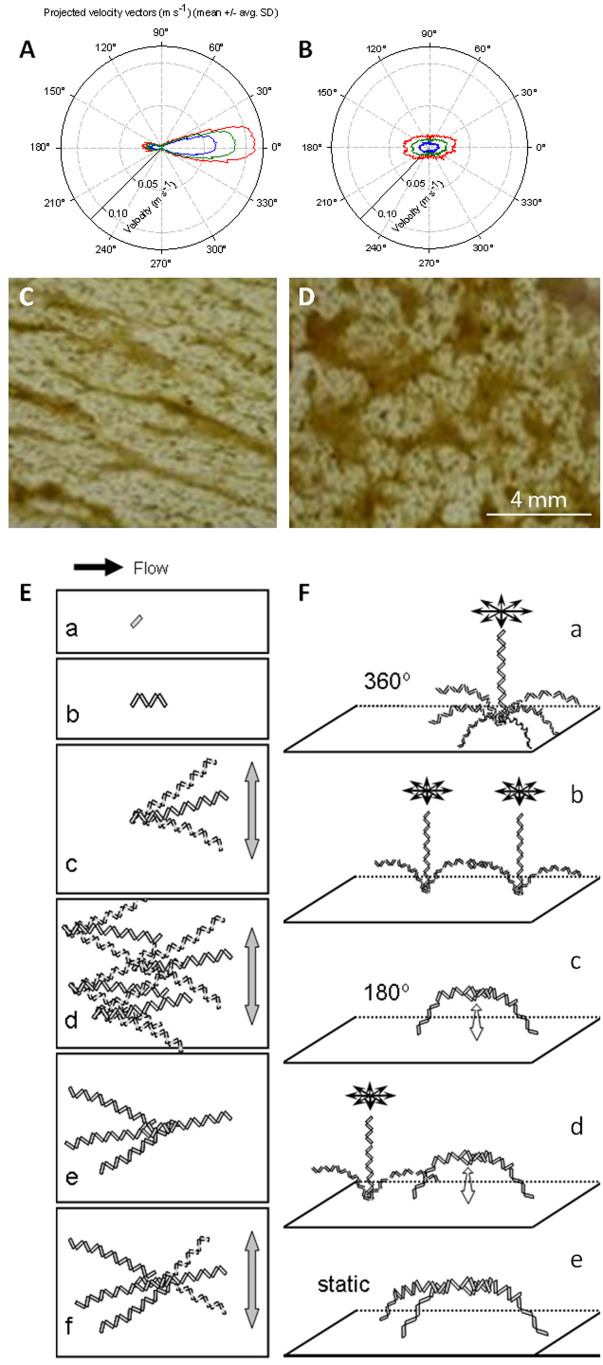
Figure 1.
(A,B) Polar charts of flow velocity magnitude and orientation on the ridge (A) and valley (B) at different heights from the river bottom. The green line indicates the mean velocity measured at 5 mm above the sediment; the blue and red lines indicate the standard deviation, SD (blue = mean - SD; red = mean + SD). (C,D) Ortho-photographic images of biofilms from the crest (C, ridge) and trough (D, valley) between two consecutive bedforms are also shown. Flow is from the left; view is from the top. Adapted from Singer et al.24. The conceptual model for colony architecture formation at the respective hydrodynamic flow conditions is shown in (E, ridge) and (F, valley). (E) At the ridge, there is fast quasi-unidirectional flow. (a) A single Diatoma cell has attached to the substratum. (b) Cell growth has occurred. (c) As the chain length increases, it begins to move with the water flow. (d) Multiple chains move back and forth, affected by the water. (e) Eventually, motion results in chains sticking together in a so-called dreadlock. (f) Although constrained, the filament dreadlock is still able to move with the water flow. (F) At the valley, there is slow multidirectional flow. (a) Multidirectional flow results in 360° filament movement. (b) Two freely moving filaments entangle. (c) A bow-shaped structure results. Movement is constrained to a 180° flapping motion. (d) A free filament near the bow-shaped structure moves in 360°, still unaffected by the bow. (e) Once the filament and the bow entangle, an almost static Y-shaped structure results.

