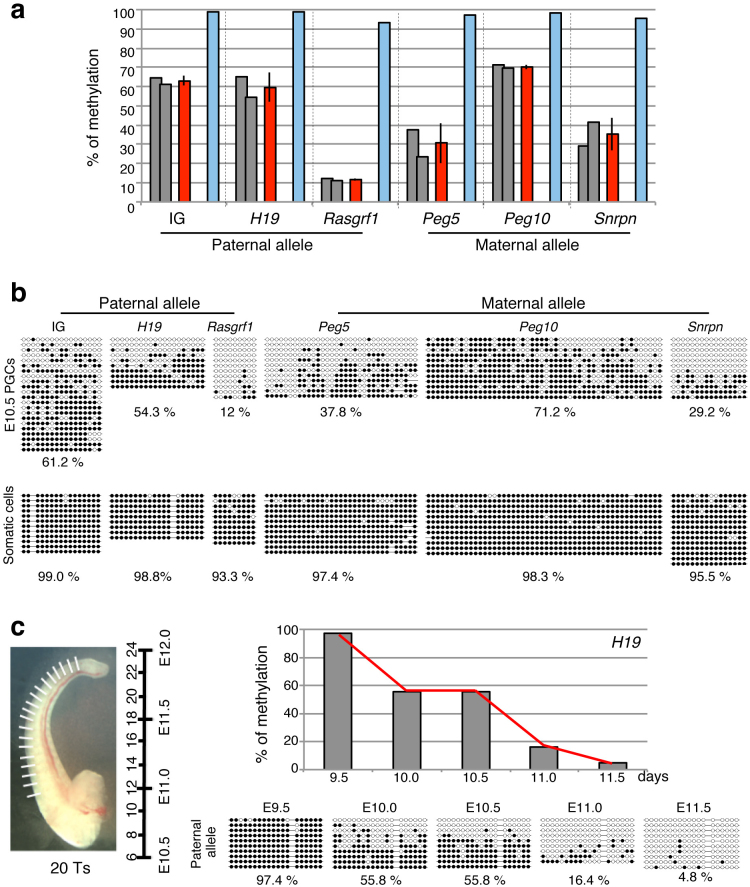
Figure 1. DNA methylation analysis of imprinted DMRs in PGCs.
(a), (b) DNA methylation level and status of DMRs in E10.5 PGCs and somatic cells. The gray and red bars represent each litter's and the average DNA methylation level of PGCs, respectively and the blue bars represent the DNA methylation level of somatic cells (a). Open circles indicate the unmethylated sites and closed circles indicate the methylated sites (b). (c) Dynamic DNA demethylation of H19-DMR in PGCs. PGCs were isolated from each stage in a manner precisely determined based on the number of tail somites (left). The bar represents DNA methylation level of the paternal allele (right, top) based on the result of bisulfite sequencing (right, bottom). Photograph by Kawasaki et al.

