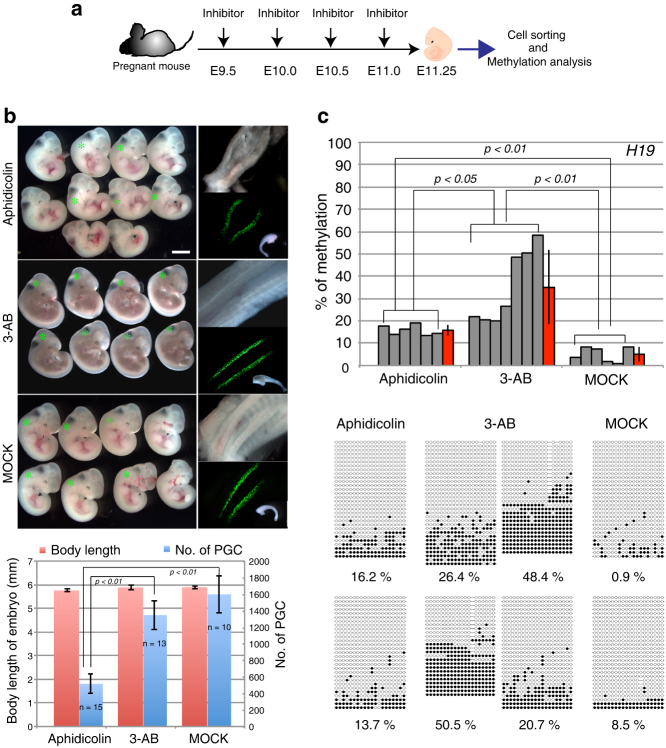
Figure 3. DNA methylation analysis of H19-DMRs in inhibitor-treated PGCs in vivo.
(a) Experimental scheme (drawings by Kawasaki et al.). After treatment of inhibitors, PGCs in the E11.25 fetus were isolated by sorting EGFP-positive cells and used for DNA methylation analysis. (b) E11.25 fetus and the dissected gonads after inhibitor treatment (top; * EGFP positive fetus). The body size of each fetus was measured (red bars) and the number of EGFP positive PGCs was counted by FACS (blue bars), as shown in the graph (bottom). Scale bar = 2mm. (c) DNA methylation level (top) and status (bottom) of H19-DMR in the inhibitor-treated PGCs, as shown by bisulfite sequencing. p value by t-test.

