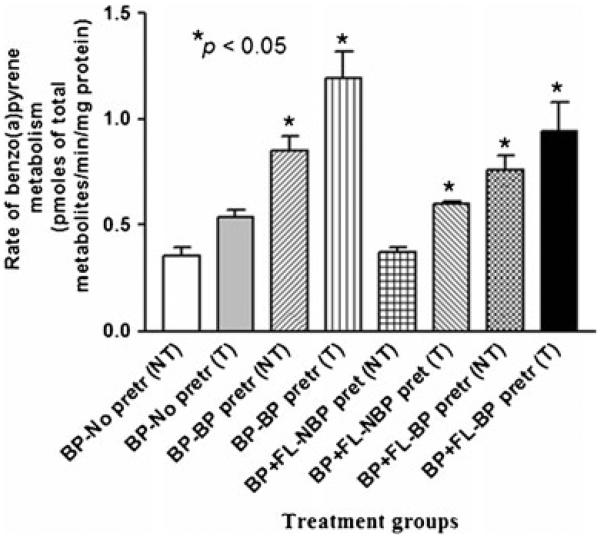
Fig. 1.
Rate of benzo(a)pyrene metabolism in colon tumor microsomes of ApcMin mice preexposed to benzo(a)pyrene. Explanations of the abbreviations are as follows: NT microsomes from non-tumorous tissues; T microsomes from tumorous tissues; BP-no pretr BaP metabolite concentrations from microsomes of unexposed mice incubated with 3 μM BaP alone; BP-BP pretr BaP metabolite concentrations from microsomes of mice pretreated with 50 μg BaP—incubated with 3 μM of BaP alone; BP + FL-NBP pretr BaP metabolite concentrations from microsomes of unexposed mice incubated with 3 μM FLA+3 μM BaP; BP + FA-BP pretr BaP metabolite concentrations from microsomes of mice pretreated with 50 μg BaP—incubated with 3 μM each of BaP and FLA. Values are expressed as mean concentration of total metabolites ± SE. Data from triplicate determination (variability was <10 %) of five individual animals from each treatment group were compared. Asterisks denote statistical significance (*p<0.05) in BaP metabolite concentrations among the treatment categories

