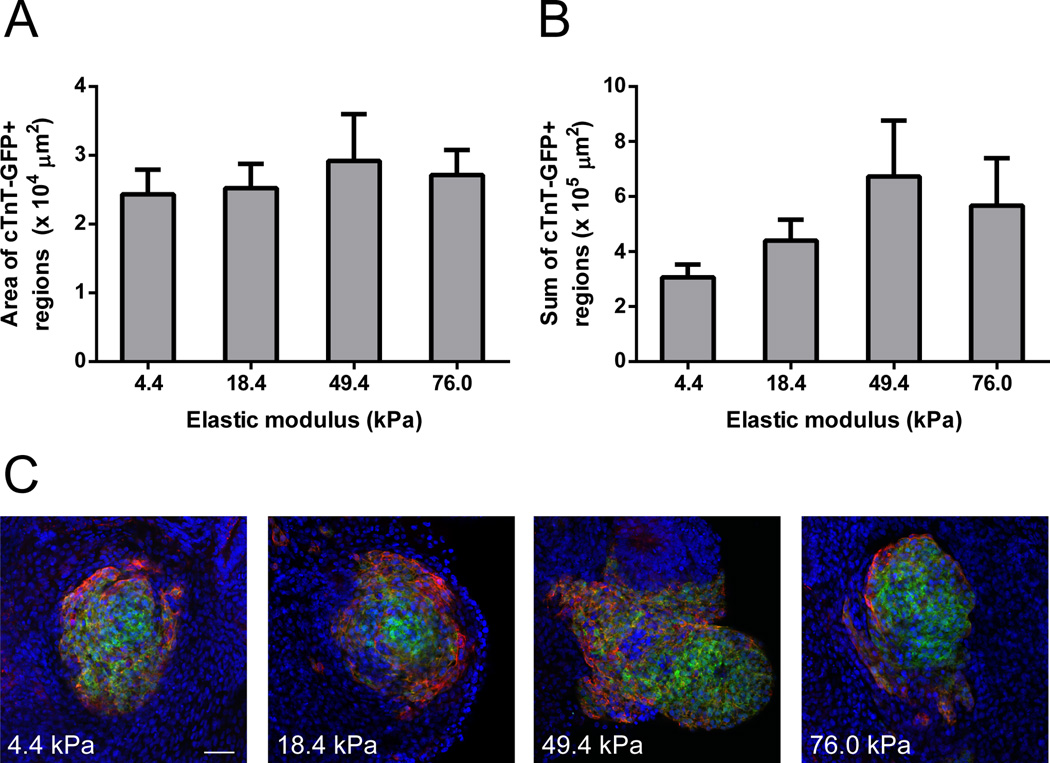
Fig. 3.
Quantification and representative images of cTnT+ regions in EBs derived from H9- hTnnTZ-pGZ-D2 cells. (A) Average area and (B) average sum of cTnT-GFP+ regions present on hydrogels of the indicated stiffnesses. EBs were seeded onto the hydrogels on day 5 and fixed on day 30. Whole-well images were obtained and analyzed using ImageJ to quantify GFP+ regions. Data from 2 independent experiments were averaged together (n = 3 wells/stiffness in experiment 1, n = 6 wells/stiffness in experiment 2). (C) Representative images of EBs on each stiffness on day 30. EBs were stained with α-actinin (red) to show its co-localization with cTnT-GFP (green). Nuclei stained with Hoechst 33342 are shown in blue. Scale bar = 50 µm.

