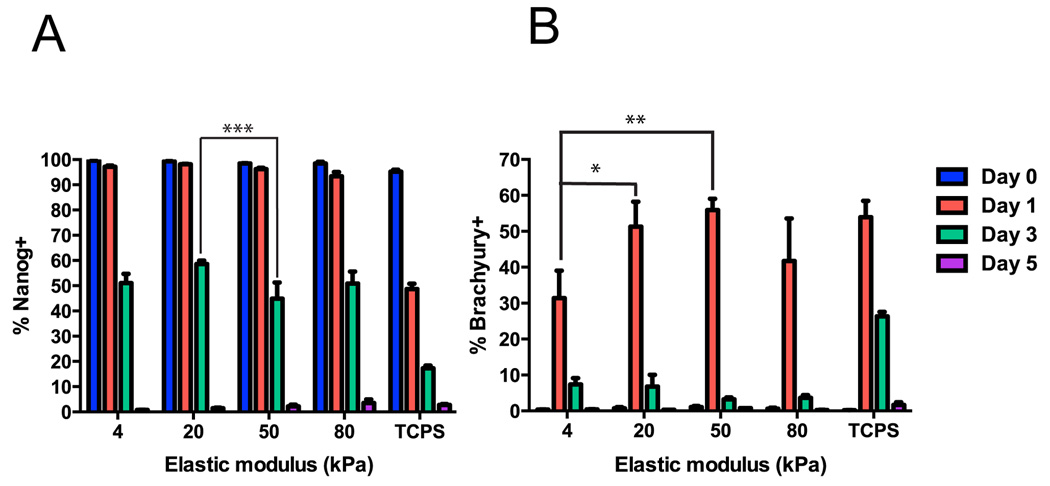
Fig. 4.
Timecourse of marker expression during early directed differentiation on hydrogels. H9 cells were seeded onto hydrogels or TCPS on day −3 and fixed for flow cytometry on days 0, 1, 3, and 5. (A) Nanog expression decreased over time on hydrogels of all stiffnesses and TCPS. On day 3, Nanog expression was significantly lower on the 50 kPa hydrogel versus the 20 kPa hydrogel (***, p < 0.001). On day 1 and day 3, Nanog expression was significantly lower on TCPS than all hydrogel stiffnesses (#, p < 0.001). (B) Brachyury expression peaked on day 1 on all stiffnesses and was significantly higher on the 20 (*, p < 0.05) and 50 (**, p < 0.01) kPa hydrogels than the 4 kPa hydrogel on day 1. Brachyury expression was significantly higher on TCPS than all hydrogels on day 3 (#, p < 0.01). For each marker, 3 wells per stiffness were analyzed on days 0, 1, and 3 and 2 or 3 wells per stiffness were analyzed on day 5 for hydrogels and TCPS respectively.

