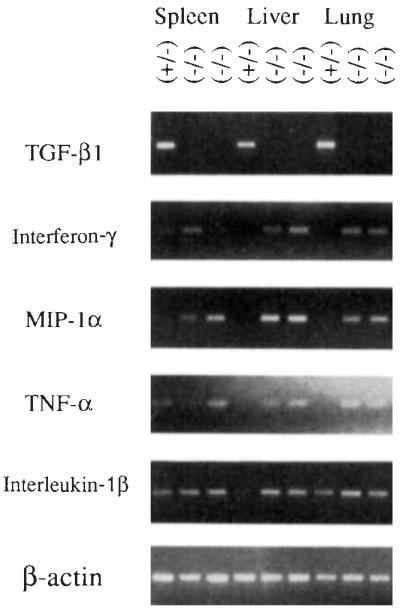
FIG. 4.
PCR analysis of cytokine mRNAs in control and TGF-β1-deficient mice. Total RNAs from spleen, liver, and lung from control mouse 249 (+/−) and homozygous mutant animals 254 and 260 (−/−) were reverse-transcribed and examined by PCR analysis using primers specific for cytokines TGF-β1 (5′-GCGGACT ACT A TGCT AAAGAGG-3′ and 5′-GTIGTGTIGGTIGT AGAGGGCA-3′, 40 cycles), interferon-γ. (5′-TGGCTGTTICTGGCTGTIACTG-3′ and 5′-AATCAGCAGCGACTCCnnCC-3′, 35 cycles), MIP-1α: (5′-ACTGCCCTIGCTGTICTICTCT-3′ and 5′-AGGCA TICAGTICCAGGTCAGT-3′,40 cycles), TNF-α: (5′-CCAGACCCTCACACTCAGAT-3′ and 5′-AACACCCATICCCTICACAG-3, 31 cycles), and interleukin-1α (5′-TGACGGACCCCAAAAGATGAAG-3′ and 5′-CTGCTIGTGAGGTGCTGA TGT A-3′, 35 cycles). Amplification conditions using a Perkin–Elmer 9600 were 95 °C, 30 S; 58 °C, 1 min; 72 °c, 2 min (extended 1 s per cycle). The final extension was allowed to continue for 10 min. Amplified products were size-fractionated by electrophoresis through agarose and visualized by ultraviolet illumination of the ethidium bromide-stained gel. With each set of samples (except TNF-α: and β-actin), positive and negative PCR controls were run. The positive control consisted of total RNA from spleen cells cultured for 48 h with concanavalin A. The negative control contained all complementary DNA synthesis and PCR reagents but lacked RNA. Correct amplification products were observed in each positive control, whereas no products were amplified in the negative controls (data not shown). All samples gave comparable signals when amplified using primers specific for β-actin (5′-GTGGGCCGCTCTAGGCACCAA-3′ and 5′-CTCTTIGATGTCACGCACGA TTIC-3′).

