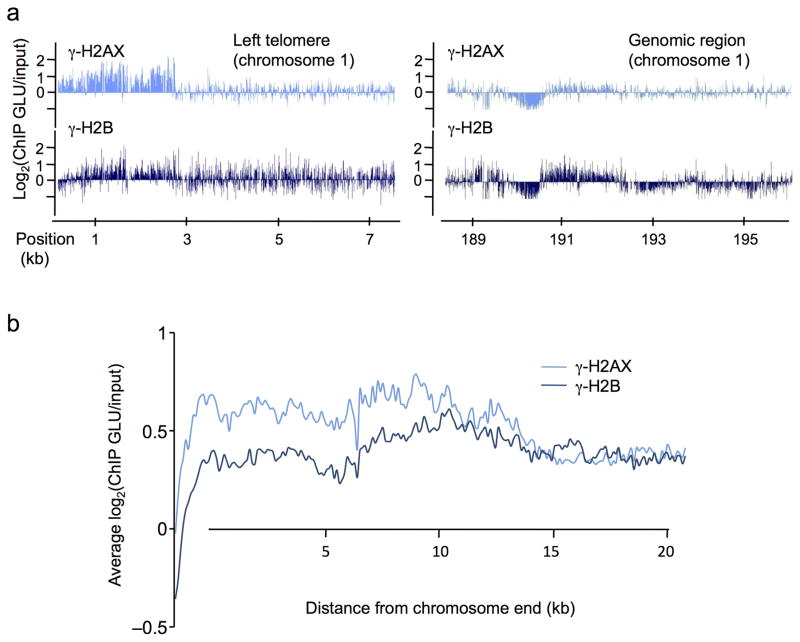
Figure 3. Profiles of γ-H2AX and γ-H2B in undamaged cells.
a. The profiles of γ-H2AX (light blue) and γ-H2B (dark blue) obtained at the left telomere of chromosome 1 (left panel) and on a genomic region farther on the same chromosome (right panel) are shown. Note that γ-H2B is less enriched than γ-H2AX at the telomere, while both signals are equivalent further away. b. γ-H2AX and γ-H2B ChIP-chip signals were averaged on 20 kb at all chromosomes ends (left and right arms combined). Note the higher level of γ-H2AX at telomeres compared to γ-H2B.

