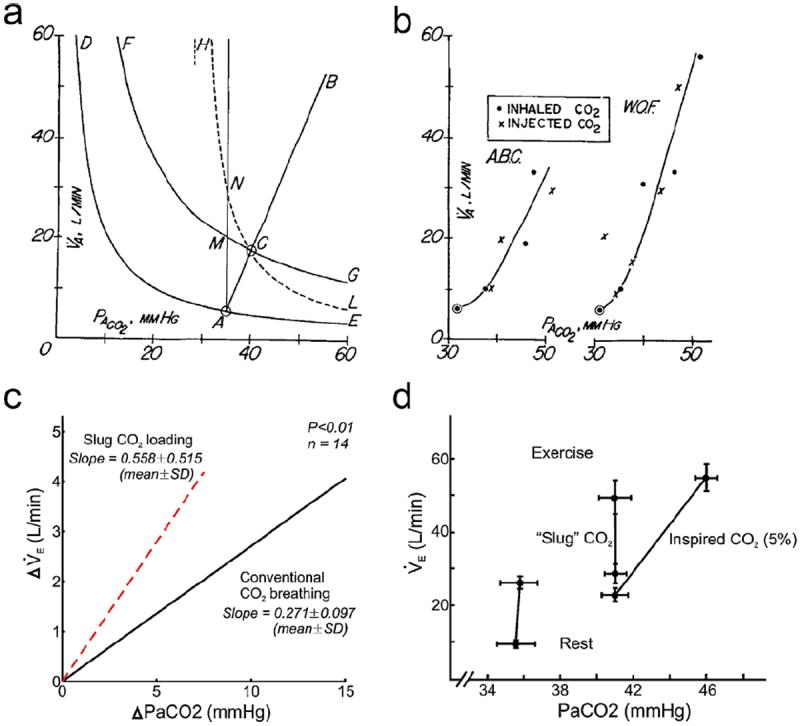
Fig. 4.

Differential effects of virtual airway CO2 load vs. apparent metabolic CO2 load on ventilatory control in different types of slug CO2 loading. a: Fenn-Craig diagram showing the metabolic hyperbolas for pulmonary CO2 exchange at rest and during exercise, CO2 breathing and (ideal) slug CO2 loading. See text. b: CO2 response curves (or more appropriately, CO2 tolerance curves) are no different under constant-flux slug CO2 loading than CO2 breathing in two subjects. Panels a and b are adapted from Fenn and Craig (1963) with permission. c: CO2 response curve in anesthetized cats is twice steeper in early-inspired slug CO2 loading than in CO2 breathing at constant PI CO2. Adapted from van der Grinten et al. (1992) with permission. d: The mechanism underlying the control of exercise hyperpnea remains intact in early-inspired slug CO2 loading, except that the apparent homeostatic “set point” is shifted to higher PaCO2 levels at rest and during exercise compared with corresponding control values (data points at left). By contrast, CO2 breathing (at 5% level) also induces hypercapnia because of its CO2-clogging effect (Comroe’s law) but homeostatic regulation at the higher PaCO2 level is lost during exercise. Adapted from (Swanson, 1978) with permission.
