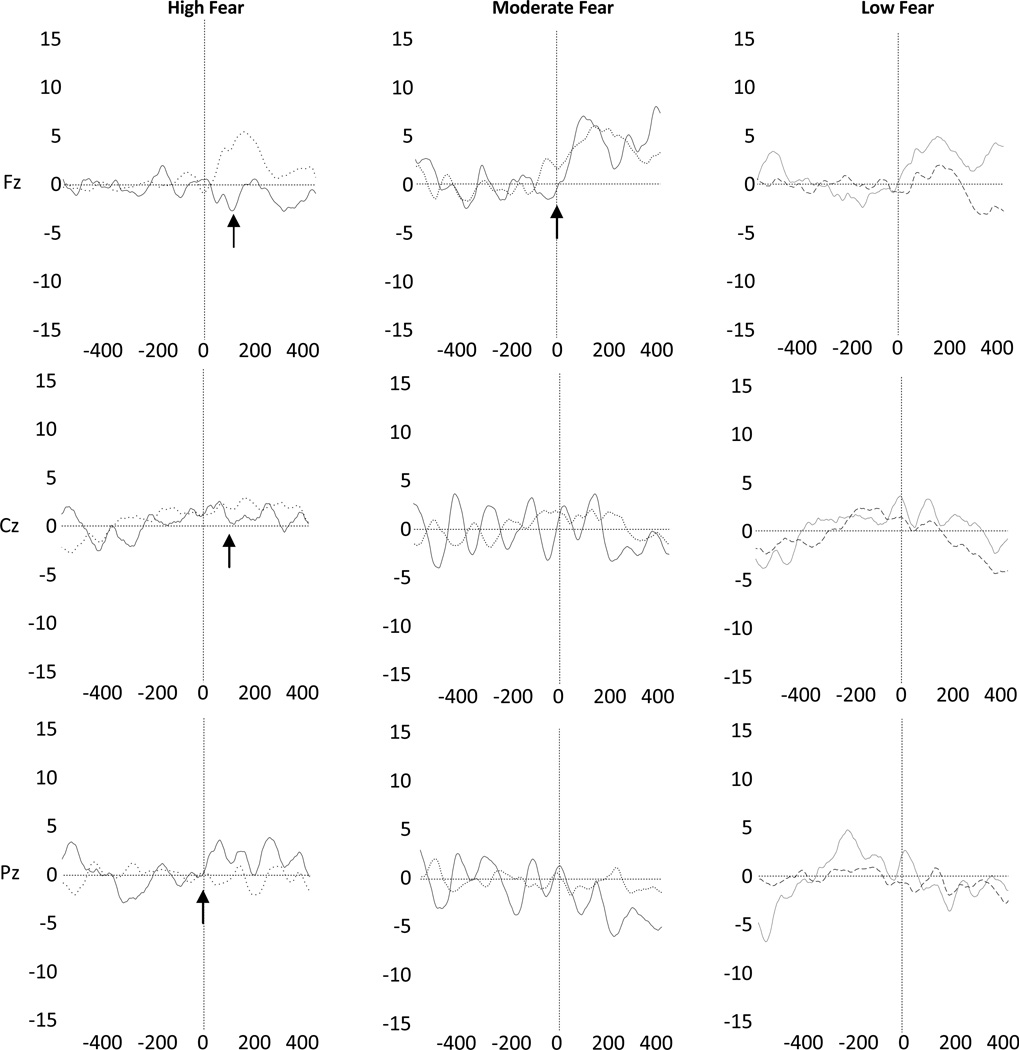
Figure 1.
Response-locked ERP waveforms at Fz, Cz, and Pz for high-fear, moderate-fear, and low-fear children.
Note: X-axis presents time in milliseconds (ms). Y-axis presents amplitude in microvolts (µV). For all groups, solid lines represent neural activity on error trials; broken lines represent neural activity on correct trials. Arrows are used to highlight the ERN effect.

