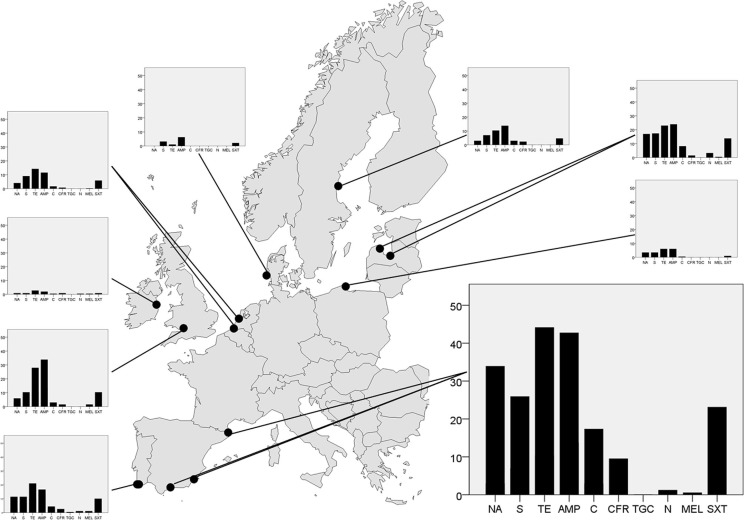
Fig. 1.
Geographical variation in gull E. coli resistance levels in nine different European countries. Dots represent sampling sites in each country, and the bar plots show average resistance levels (%) to each of the analysed antibiotics. The antibiotics, from left to the right: nalidixic acid (NA), streptomycin (S), tetracycline (TE), ampicillin (AMP), chloramphenicol (C), cefadroxil (CFR), tigecycline (TGC), nitrofurantoin (N), mecillinam (MEL) and trimethoprim/sulfamethoxazole (SXT). The bar plot from Spain is enlarged to indicate the scale used.

