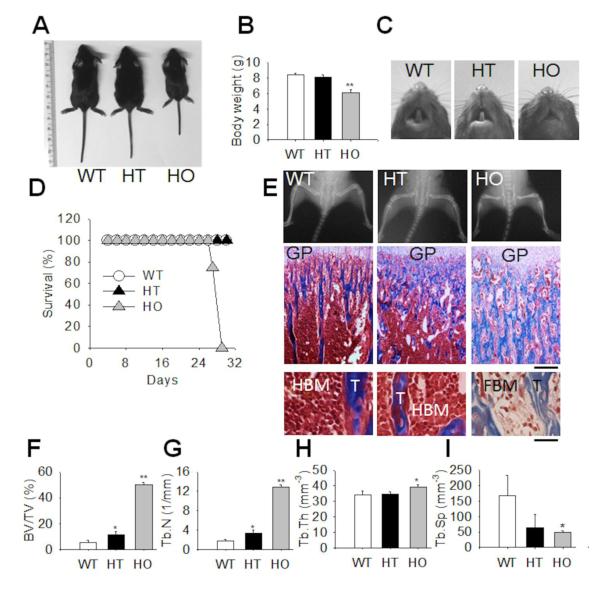
Figure 2. B6 mouse phenotyping.
Thirty days old wild-type (WT), heterozygous (HT) and homozygous (HO) B6 mice were sacrificed and evaluated for (A) gross appearance, (B) body weight (B6) (n=3; **p<0.02), (C) tooth eruption and (D) survival (B6). (E) X-ray analysis of hindlimbs, pelvis and vertebrae (upper panels) and histological examination of tibia proximal spongiosa (Masson’s trichrome staining) (middle and lower panels). GP: growth plate. HBM: hematopoietic bone marrow. FBM: fibrotic bone marrow. T: trabecula. Middle panels; bar = 200 μm. Lower panels: bar = 30 μm. Histomorphometric evaluation of proximal tibia (F) trabecular bone volume/total tissue volume (BV/TV), (G) trabecular number (Tb.N), (H) trabecular thickness (Tb.Th) and (I) trabecular separation (Tb.Sp). Data are the mean±s.d. of 3 mice per group; *p<0.05; **p<0.002.

