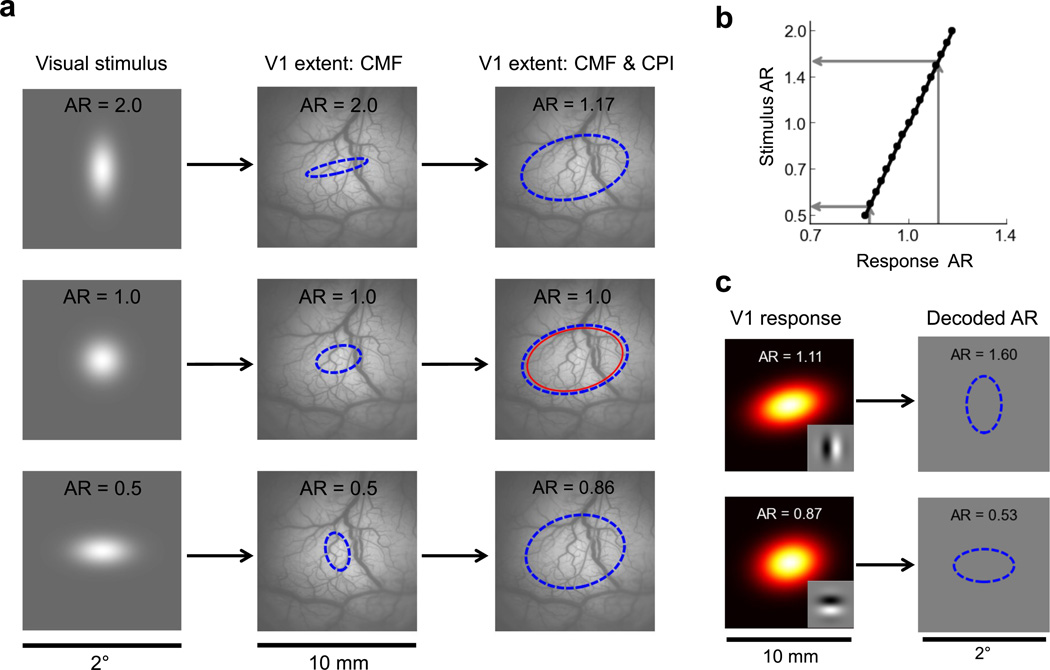
Figure 5.
Modeling the relationship between the spatial extent of a visual stimulus and the retinotopic extent of its elicited cortical response. a) A schematic representation of the cortical responses to vertical (top row), isotropic (middle row), and horizontal Gaussian stimuli. The first column shows the visual stimulus; the second column illustrates the mapping due to the fixed retinotopic projection to V1 (shown in Fig. 3b), which can be expressed in terms of the local cortical magnification factor (CMF); and the third column illustrates the added effect of the cortical point image (CPI), whose size is indicated by the thin red ellipse in the central row. The dashed blue ellipses represent the 2σ Gaussian envelope contours of the predicted VSDI responses. Retinotopic aspect ratios (AR) are indicated at the top of each subpanel. b) Predicted aspect ratio of a Gaussian stimulus as a function of the retinotopic aspect ratio of its elicited response. Due to the large size of the CPI relative to the retinotopic extent of the visual stimuli, the aspect ratio of the elicited cortical response is retinotopically "compressed", with an envelope that tends to be more isotropic than that of the eliciting stimulus. c) Perceptual orientation-dependent elongation predicted by the V1 model for the 2cpd vertical (top) and horizontal (bottom) circular Gabor stimuli if observers compensate for the effects of the aspect ratio compression shown in (b). The dashed blue ellipses represent the predicted 2σ Gaussian envelope contour of the perceived stimulus.

