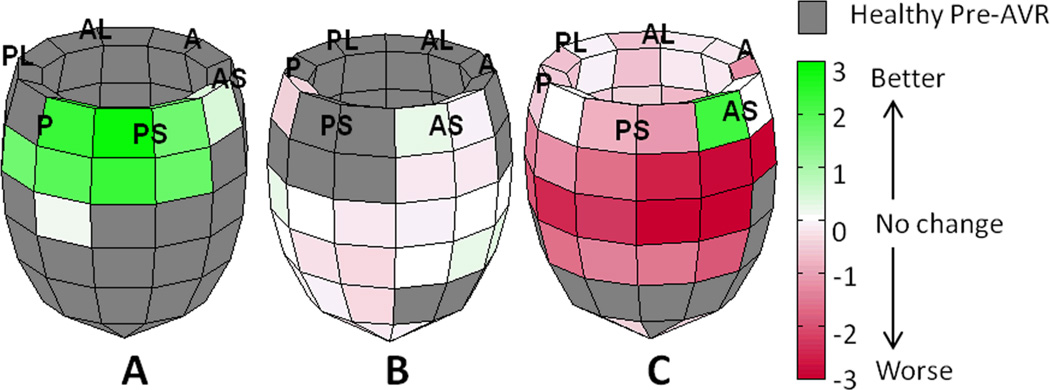
Figure 5. Post-AVR outcome models.
LV outcome models from three AI patients are shown with regional differences plotted as preoperative MSZ minus postoperative MSZ. The global average MSZ is a significant predictor of the amount of regional improvement after AVR (R2 = .392, p < .001). The preoperative global average MSZ from patients A, B, and C were .05, 1.02, and 1.62 respectively. The amount of regional improvement after AVR expected for any given region is as follows: Patient A, 1.846 - 1.744(.05) = 1.76 standard deviations (SD); Patient B, 1.846 - 1.744(1.02) = .07 SD; Patient C, 1.846 - 1.744(1.62) = −.98 SD. (P—posterior, PL—posterior lateral, AL—anterior lateral, A—anterior, AS—anterior septum and PS—posterior septum)

