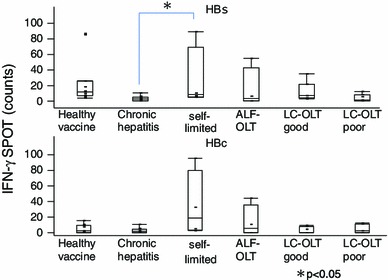
Fig. 3.

Cellular immune responses against HBsAg including OLT patients. The number of spots due to interferon-γ response in the ELISPOT assay for HBsAg (upper figure) and HBcAg (lower figure) is shown. 1 Healthy vaccine: healthy controls who were positive for anti-HBs antibodies with HBV vaccine (n = 11). 2 Chronic hepatitis: chronic hepatitis B patients (n = 10). 3 Self-limited: self-limited acute hepatitis B patients who showed serum anti-HBs antibody-positive/HBcAb-positive with no HBsAg or HBV-DNA (n = 5). 4 ALF-OLT: post-OLT acute liver failure patients (n = 4). 5 LC-OLT good: post-OLT liver cirrhosis patients who showed good response to vaccine (n = 8). 6 LC-OLT poor: post-OLT liver cirrhosis patients who showed poor response to vaccine (n = 7). Values are plotted as median (range)
