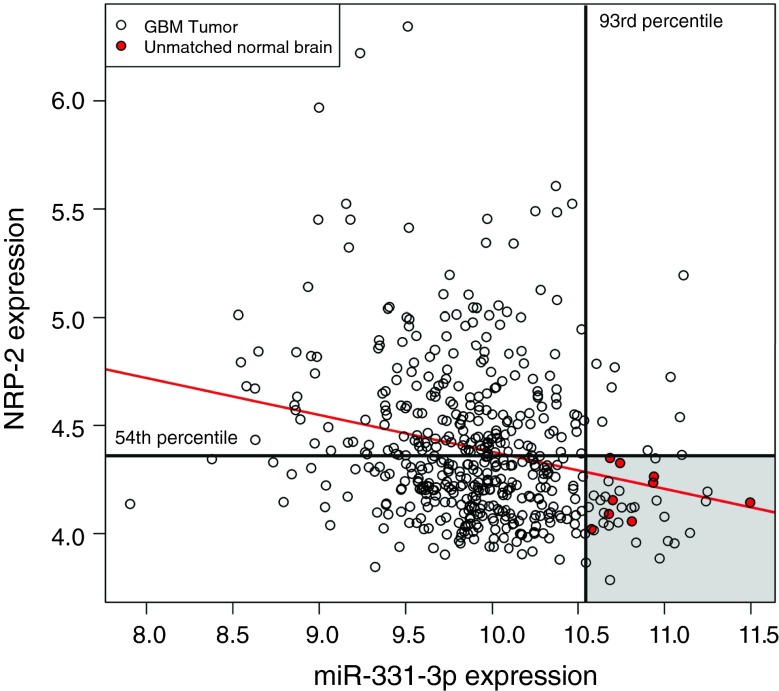
Fig. 5.
Inverse association between expression of miR-331-3p and NRP-2 in The Cancer Genome Atlas (TCGA) GBM cohort. Scatterplot of miR-331-3p and NRP-2 expression in GBM (unfilled circles) and unmatched normal brain (red-filled circles) tissue samples from TCGA with fitted regression line (red line). The 93rd percentile of miR-331-3p expression in the GBM samples (vertical black line) and 54th percentile of NRP-2 expression in the GBM samples (horizontal black line) delineate the range of expression values of the normal brain samples (shaded grey area). Scale indicates NRP-2 (vertical) and miR-331-3p (horizontal) probe intensities

