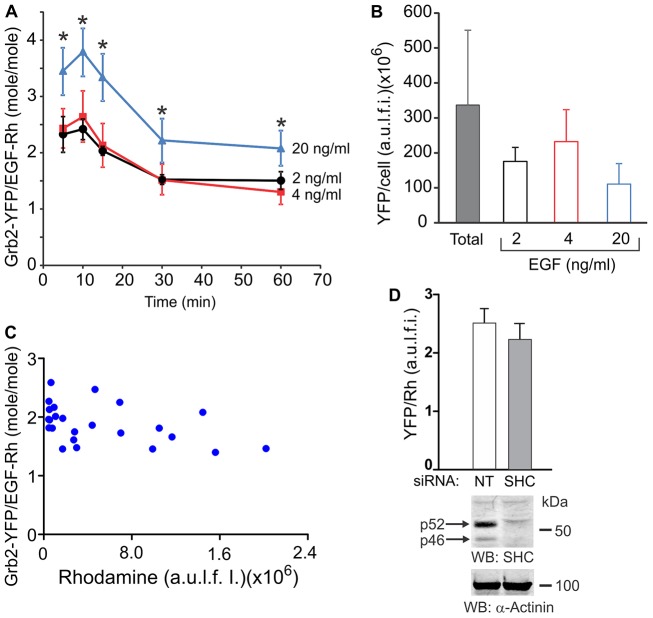
Fig. 4.
Molar stoichiometry of colocalized Grb2–YFP and EGF–Rh. (A) Cells were incubated with 2, 4 or 20 ng/ml EGF–Rh for the indicated times. Total cellular YFP and Rhodamine fluorescence intensities were calculated from 3D images acquired as in Fig. 2. Single-cell segmentation-based image analysis was performed to obtain the ratio of Grb2–YFP:EGF–Rh fluorescence intensities in colocalized voxels in individual cells, and values of the Grb2–YFP:EGF–Rh molar ratios in whole cells were calculated as described in Materials and Methods. Error bars represent s.e.m. The data are averaged from five to eight cells at each time point. *P<0.05, 20 ng/ml treated cells compared to the corresponding time-points in cells treated with 2 or 4 ng/ml EGF–Rh. (B) The mean amounts of Grb2–YFP per cell in the entire population of cells (total; n = 79) and in cells treated with 2, 4 and 20 ng/ml EGF–Rh that were used to determine Grb2–YFP:EGF–Rh ratios in A were calculated from 3D images similar to those presented in Fig. 2. Note, Grb2–YFP/EGF–Rh stoichiometry was calculated in A in cells expressing 30–70% lower amounts of Grb2–YFP/cell than the mean Grb2–YFP amount per cell. (C) Representative example of Grb2–YFP:EGF–Rh molar ratios in individual endosomes of a single cell plotted against the amount of the Rhodamine fluorescence per endosome. (D) Cells were transfected with non-targeting (NT) or ShcA (SHC) siRNAs. After 3 days, the cells were incubated with 2 ng/ml EGF–Rh for 15 minutes at 37°C, and the Grb2–YFP:EGF–Rh ratio was measured as in A. The data in the bar graph are mean values (± s.d.) from multiple cells combined from two independent experiments. In parallel, cell lysates were probed by western blotting for Shc and α-actinin (loading control). The blots show efficient knockdown of two major Shc species (p46 and p52) present in HeLa-Grb2–YFP cells.

