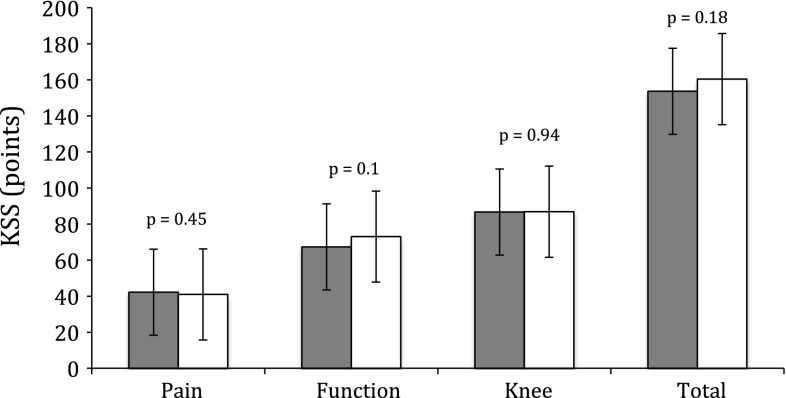
Fig. 5.
A graph shows latest KSSs in patients converted to TKA from lateral closing-wedge and medial opening-wedge HTOs. Dark gray and white bars represent the lateral closing-wedge and medial opening-wedge cohorts, respectively. KSSs revealed no differences between groups for pain, function, knee, and total scores (p = 0.45, p = 0.1, p = 0.95, and p = 0.18, respectively).

