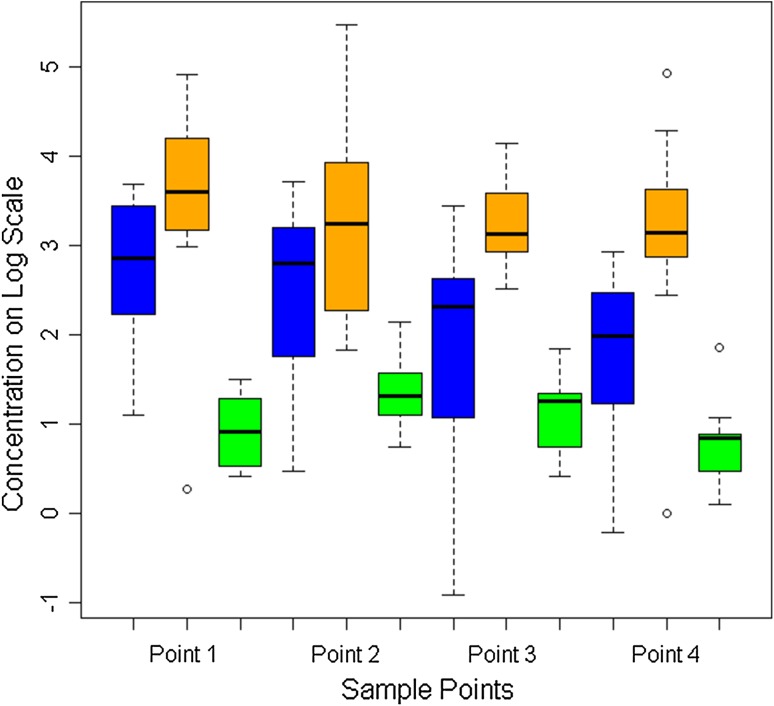
Fig. 2.
A graph show the tissue concentrations of vancomycin in subcutaneous fat at each sample point. The 250-mg IORA group is in blue, 500-mg IORA group in orange, and 1-g systemic group in green. Concentrations on log scale: 2 = 7 μg/g, 4 = 55 μg/g, and 6 = 403 μg/g. Box represents the median; horizontal line in box represents the 25% and 75% quartiles; whiskers represent 1.5 times the interquartile range from the box.

