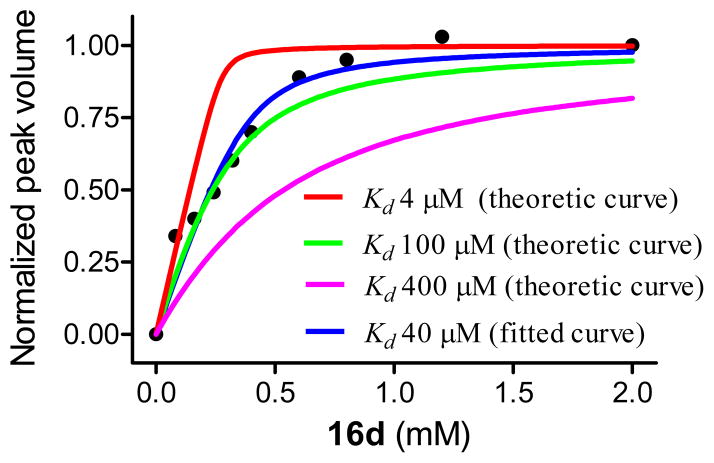
Figure 1.
Binding affinity of 16d to wt M2TM as determined by solution NMR drug titration. Normalized peak volume of the W41 Hε1 in the drug-bound form was plotted as a function of 16d concentration. The fitting yields a stoichiometry ratio of 1.37 ± 0.28 drug/tetramer with a Kd of 40 ± 24 μM (curve shown in blue). In comparison, theoretical curve fittings with fixed stoichiometry (N=1) and Kd of 4 μM, 100 μM and 400 μM are shown in red, green, and pink, respectively. Details about curve fitting can be found in the Supporting Information.

