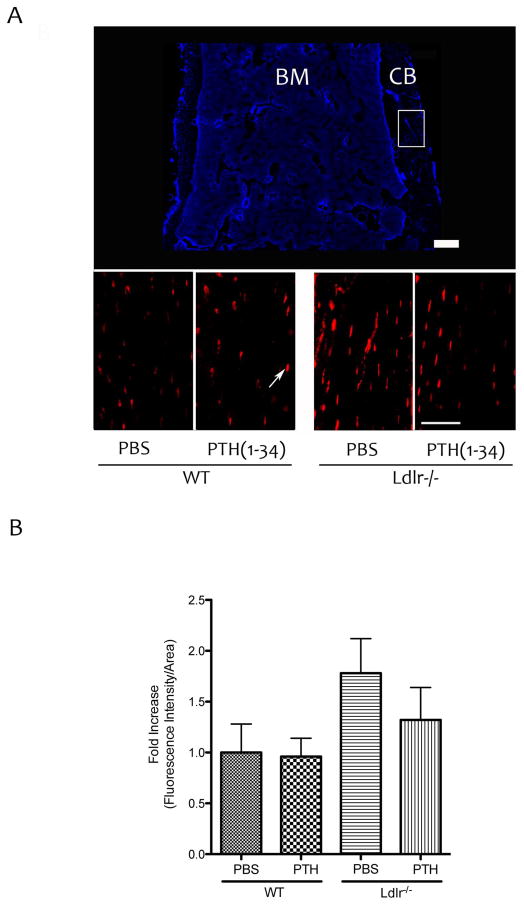
Figure 3. Effects of PTH(1-34) on GFP-labeled osteocytes.
(A) Top panel – DAPI image of distal femoral bone from Cyan mice [bone marrow (BM), cortical bone (CB)]. Bottom panels – immuno-fluorescence images of the area marked by the white rectangular box using anti-GFP antibody. Arrow indicates fluorescence labeled osteocytes. Magnification bar − 200 μm. (B) Quantitation by Metamorph image analysis.

